Figure 1.
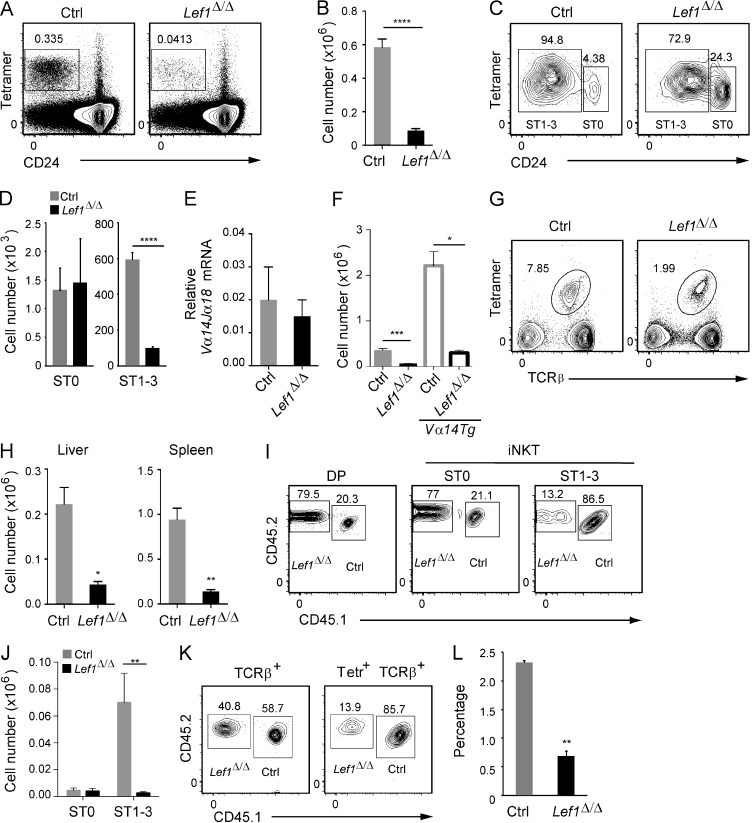
Lef1Δ/Δ mice lacked iNKT cells in the thymus and the periphery. (A) Thymi from control (Ctrl) and Lef1Δ/Δ mice were stained for CD24 and CD1d-PBS57 tetramers (Tetr) and analyzed by flow cytometry. The percentage of total thymocytes that were Tetramer+CD24lo iNKT cells is shown. (B) Mean number of thymic Tetr+CD24lo iNKT cells in control and Lef1Δ/Δ mice. Bars represent the mean from 10 independent experiments, with one pair of mice each. (C) The frequency of Tetr+CD24hi (ST0) and Tetr+CD24lo/− (ST1–3) among total thymic iNKT cells was determined by flow cytometry after MACS-based tetramer enrichment. (D) Absolute number of ST0 and ST1–3 iNKT cells from control and Lef1Δ/Δ mice. Data represent the mean from six independent experiments with one to two mice per genotype. (E) Expression of Vα14Jα18 mRNA transcripts relative to Hprt in sorted DP thymocytes from control and Lef1Δ/Δ mice was determined by qRT-PCR. Data represent the mean from four independent experiments. (F) Mean number of thymic Tetr+CD24lo iNKT cells in the indicated mouse strains from five independent experiments. (G) TCRβ and CD1d-PBS57 tetramer staining on liver cells from control and Lef1Δ/Δ mice was determined by flow cytometry. Numbers indicate the percentage of liver lymphocytes that are Tetr+TCRβ+. (H) Mean number of Tetr+TCRβ+ iNKT cells in the liver and spleen of control and Lef1Δ/Δ mice. Bars represent the mean from four independent experiments. (I) CD45.1+CD45.2+ control and CD45.1−CD45.2+ Lef1Δ/Δ FACS-sorted LK bone marrow cells were mixed at a 1:1 ratio, and 5 × 10⁴ total cells were transferred into lethally irradiated CD45.1+ C57BL/6 mice. Mice were analyzed 6–8 wk after transplantation. Expression of CD45.1 and CD45.2 on DP thymocytes, ST0 iNKT cells, or ST1–3 iNKT cells from competitive bone marrow chimeras was determined by flow cytometry. The percentage of DP cells or CD24hi ST0 and CD24lo ST1–3 iNKT cells derived from CD45.1+CD45.2+ control or CD45.1−CD45.2+ Lef1Δ/Δ bone marrow cells is shown. Data are representative of three independent experiments with two to three chimeras each. (J) The mean number of ST0 CD24hi and ST1–3 CD24lo thymic iNKT cells derived from the CD45.1+CD45.2+ control or CD45.1−CD45.2+ Lef1Δ/Δ bone marrow cells is shown. (K) Expression of CD45.1 and CD45.2 on TCRβ+ (Tetr−) cells and Tetr+TCRβ+ iNKT cells in the liver of competitive mixed bone marrow chimeras was determined by flow cytometry. The gated regions show the percentage of cells that are derived from the control or Lef1Δ/Δ bone marrow. (L) Mean percentage of iNKT cells in the competitive chimeric mice that are derived from the control or Lef1Δ/Δ bone marrow. Numbers are the mean from three independent experiments with two to three chimeras each. All error bars represent SEM. *, P < 0.05; **, P < 0.01; ***, P < 0.001; ****, P < 0.0001.

