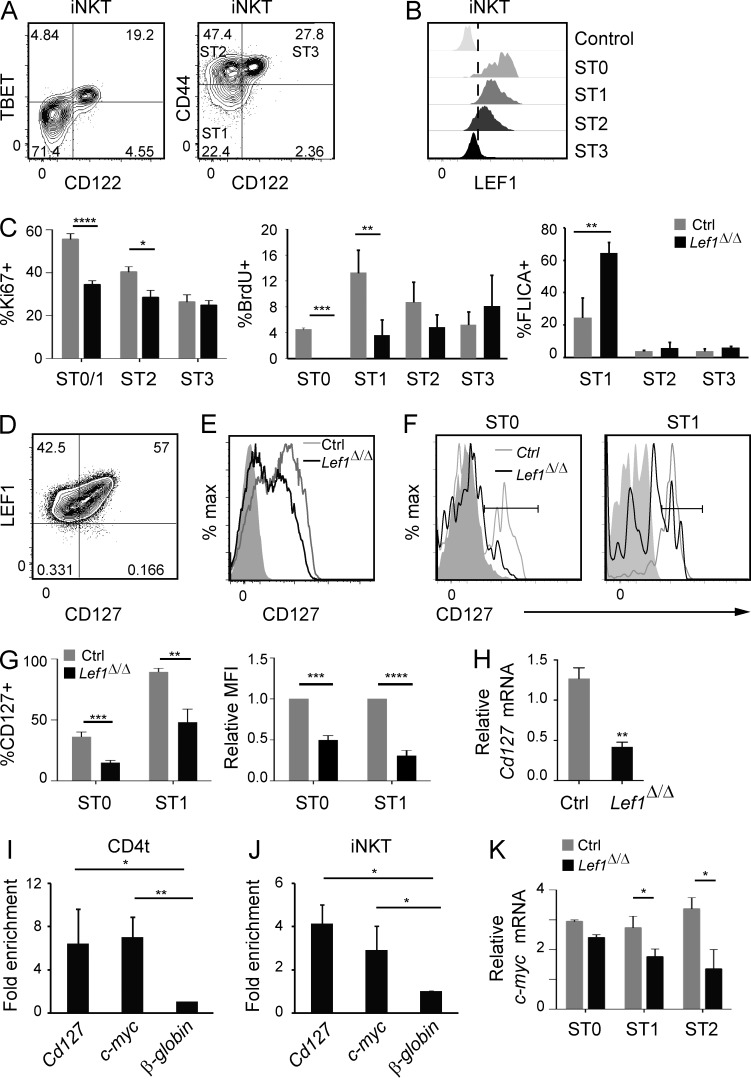
Figure 2.
LEF1 promoted iNKT cell proliferation and regulated expression of the Cd127 and c-myc genes. (A) Expression of TBET (left) or CD44 (right) and CD122 on WT FVB/NJ Tetr+CD24lo thymic iNKT cells was determined by flow cytometry. The percentage of cells and iNKT cell stage in each quadrant is shown. (B) Expression of LEF1 was determined by flow cytometry in the indicated iNKT cell stages from WT FVB/NJ mice and is shown as a histogram. iNKT cell stages were gated as shown in A (ST1, ST2, and ST3) and in Fig. 1 C (ST0). The control sample was LEF1 staining in Lef1Δ/Δ iNKT cells. Plots are representative of at least 10 independent experiments with one to two mice per genotype. (C) Percentage of the indicated iNKT cell stage staining positive for Ki67, BrdU, or FLICA in the thymus of control and Lef1Δ/Δ mice. Graphs represent the mean of four independent experiments. (D) Expression of LEF1 and CD127 in CD4t (gated as CD4hiCD8loTCRβ+CD69+) WT FVB/NJ thymocytes was determined by flow cytometry. (E and F) CD127 expression in CD4t thymocytes (E) or ST0 and ST1 (F) iNKT cells from control and Lef1Δ/Δ mice was determined by flow cytometry. Data are representative of four to eight independent experiments with one to two mice per genotype. Solid gray histograms show staining with the isotype control antibody. (G) The mean percentage of CD127+ cells (left) or the MFI of CD127 (right) within ST0 and ST1 iNKT cells in control and Lef1Δ/Δ mice. Numbers were averaged from six independent experiments with one mouse per genotype. (H) Expression of Cd127 mRNA relative to Hprt from sorted ST0 iNKT cells (Tetr+TCRβ+CD24hi) was determined by qRT-PCR. The bar graphs represent the mean from three independent experiments. (I and J) LEF1 chromatin binding was determined by α-LEF1 ChIP on sorted CD4t thymocytes (I) or ST1/2 Vα14Tg thymic iNKT cells (J; Tetr+TCRβ+CD24loCD122−), followed by qPCR using primers spanning a TCF1/LEF1 binding site at the Cd127 and c-myc promoter region or an unrelated sequence at the β-globin gene locus. Numbers indicate mean fold enrichment of the immunoprecipitated DNA relative to the β-globin locus from three independent experiments. (K) Expression of c-myc mRNA relative to Hprt mRNA from sorted ST0, ST1, and ST2 iNKT cells was determined by qRT-PCR. Bar graphs represent the mean of three independent experiments. All error bars represent SEM. *, P < 0.05; **, P < 0.01; ***, P < 0.001; ****, P < 0.0001.

