Figure 3.
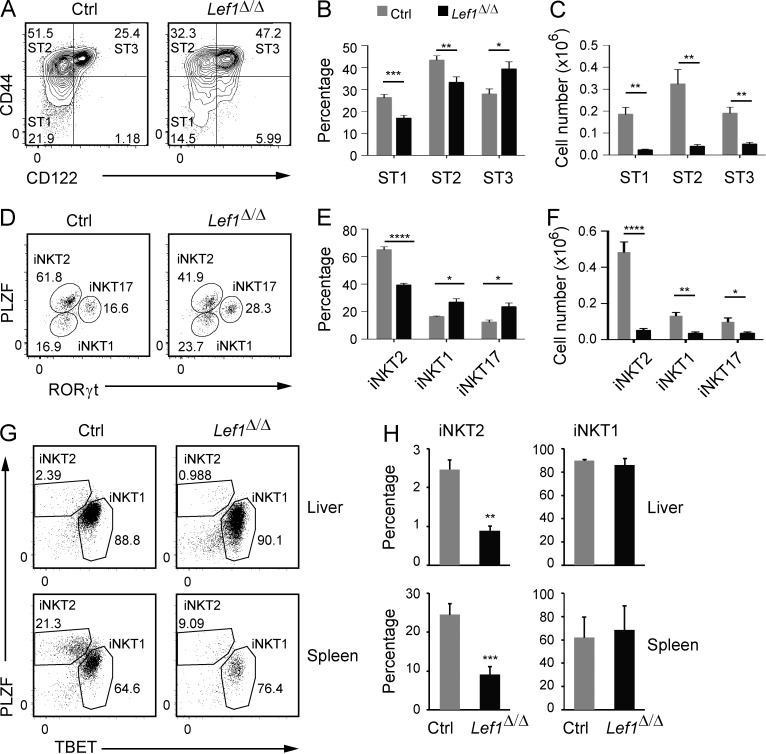
LEF1 was required for iNKT2 development. (A) Expression of CD44 and CD122 on gated Tetr+CD24lo iNKT cells from the thymus of control and Lef1Δ/Δ mice was determined by flow cytometry. (B and C) The mean percentage (B) and number (C) of ST1, ST2, and ST3 cells among total iNKT cells in control and Lef1Δ/Δ mice. Data are the mean from eight independent experiments with one mouse per genotype. (D) PLZF versus RORγt expression in Tetr+CD24lo iNKT cells from control and Lef1Δ/Δ mice was used to resolve the iNKT1 (PLZFloRORγt−), iNKT2 (PLZFhiRORγt−), and iNKT17 (PLZFintRORγt+) effector subsets by flow cytometry. Numbers show the percentage of each population among total iNKT cells. (E and F) The mean percentage (E) and number (F) of iNKT1, iNKT2, and iNKT17 cells in the thymus of control and Lef1Δ/Δ mice. Data are the mean from five independent experiments. (G) Expression of PLZF and TBET was used to identify iNKT1 and iNKT2 cells in the liver and spleen of control and Lef1Δ/Δ mice by flow cytometry. (H) The mean percentage of iNKT2 and iNKT1 among total iNKT cells in the liver and spleen from control and Lef1Δ/Δ mice. Numbers were averaged from three independent experiments. All error bars represent SEM. *, P < 0.05; **, P < 0.01; ***, P < 0.001; ****, P < 0.0001.

