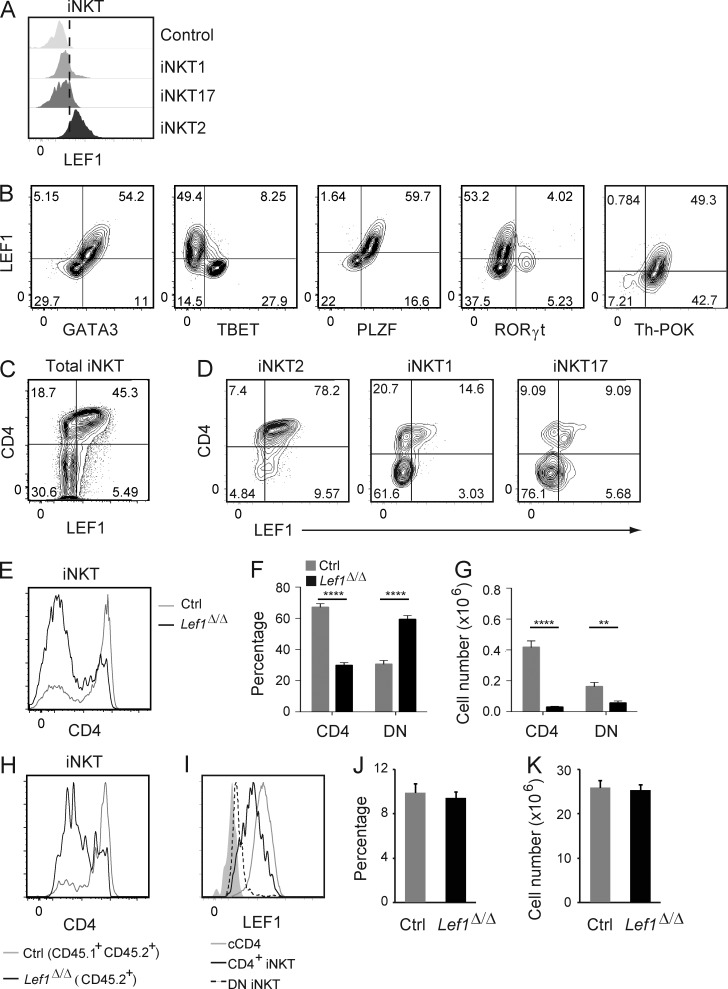
Figure 5.
LEF1 expression correlated with CD4, GATA3, PLZF, and Th-POK and supported development of CD4+ iNKT cells. (A) Expression of LEF1 in the indicated iNKT effector cells from WT FVB/NJ mice was determined by flow cytometry and is shown as a histogram. The control sample was LEF1 staining in Lef1Δ/Δ iNKT cells. Plots are representative of at least four independent experiments with one to two mice per genotype. (B) Expression of LEF1 and GATA3, TBET, PLZF, RORγt, or Th-POK in WT FVB/NJ thymic iNKT cells was determined by flow cytometry. The percentage of cells in each quadrant is indicated. Plots are representative of at least six independent experiments with one to two mice per genotype. (C and D) Expression of LEF1 and CD4 in total iNKT cells (C) or iNKT2 (PLZFhiTBET−), iNKT1 (PLZFloTBET+) and iNKT17 (RORγt+TBET−; D) cells from the thymus of WT FVB/NJ mice was determined by flow cytometry. Results are representative of at least four independent experiments. (E) CD4 expression on total thymic iNKT cells from control and Lef1Δ/Δ mice was determined by flow cytometry and is shown as histograms. (F and G) The mean percentage (F) and number (G) of CD4+ and CD4−CD8− (DN) thymic iNKT cells in the indicated mouse strains. Data were averaged from >10 independent experiments. (H) CD45.1+CD45.2+ control and CD45.1−CD45.2+ Lef1Δ/Δ FACS-sorted LK bone marrow cells were mixed at 1:1 ratio and transferred into lethally irradiated CD45.1+ C57BL/6 mice. 6–8 wk later, reconstituted mice were analyzed by flow cytometry for CD4 expression on control (CD45.1+CD45.2+) and Lef1Δ/Δ (CD45.2+) thymic iNKT cells. (I) LEF1 expression in cCD4+ thymocytes (cCD4), thymic CD4+ iNKT, and thymic DN iNKT cells was determined by flow cytometry. Solid gray histogram was LEF1 staining in LEF1-deficient iNKT cells. Histograms are representative of at least 10 independent experiments with one to two mice per genotype. (J and K) The percentage (J) and number (K) of cCD4 cells in the thymus of control or Lef1Δ/Δ mice. Graphs show the mean from 10 independent experiments. Error bars represent SEM. **, P < 0.01; ****, P < 0.0001.

