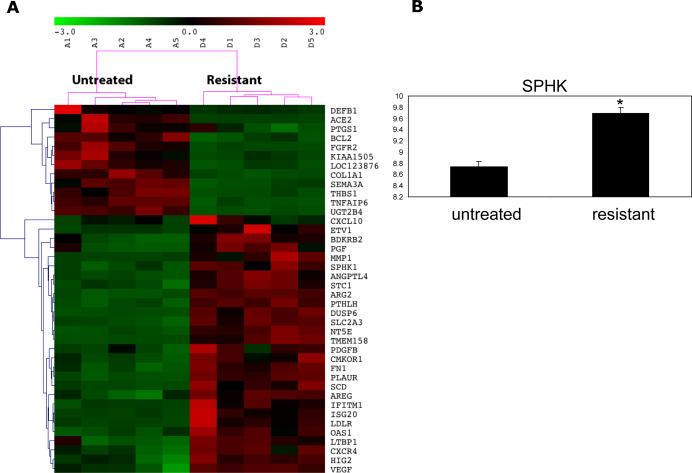
Figure 1.
Heatmap depicting transcripts that are differentially expressed in untreated vs sorafenib resistant murine 786-O tumors is shown. The columns represent the samples and rows represent the genes. Gene expression is shown with pseudocolor scale (-3 to 3) with red denoting high expression level and green denoting low expression (A). RT-PCR for SPHK1 is shown in B and is elevated in resistant tumors vs untreated tumors (P=0.005).

