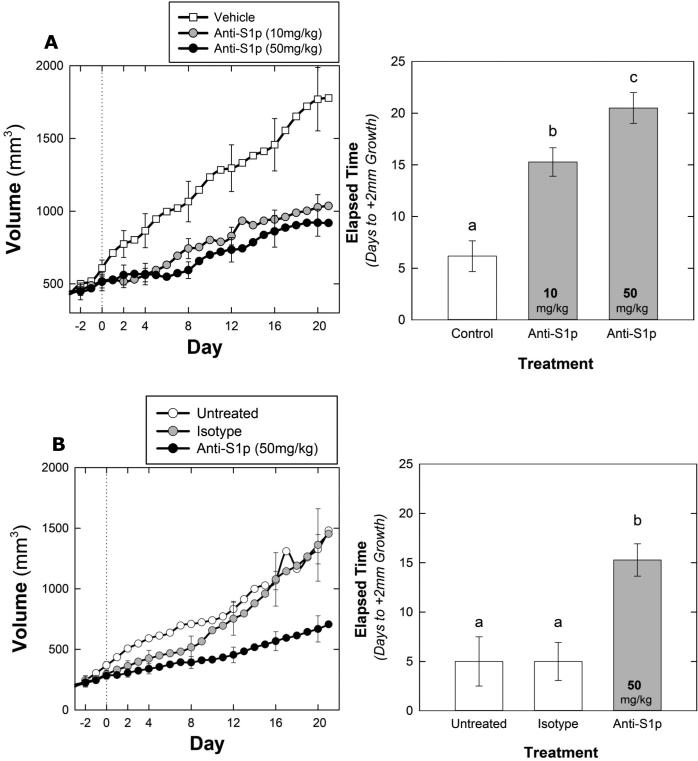
Figure 4.
Growth curves depicting average tumor volume of 786-O (A) derived tumors from mice treated with vehicle gavage (n = 6), sphingomab (10 mg/kg, n=7) (A), sphingomab (50 mg/kg, n=6). A (left) Vehicle treated tumors increased in volume more quickly than those treated with sphingomab (F2, 16 = 4.228, p = 0.034). Average time to +75% volume was 8.5 days in the control versus 14.7 and 17.5 days in the 10 mg/kg and 50 mg/kg groups, respectively. (right) Control tumors increased in length more quickly than those treated with sphingomab (F2, 16 = 23.437, p < 0.001) and all pairwise treatments were significantly different. Average time to +2mm was 6.2 days in the control versus 15.3 and 20.5 days in the 10 mg/kg and 50 mg/kg groups, respectively.
(B)Tumor growth in the A498 model is shown (left) vehicle treated tumors increased in volume more quickly than those treated with sphingomab (F2, 12 = 4.244, p = 0.040). Average time to +75% was 7.3 days for untreated tumors (n = 3), 8.2 days for isotype treated (n = 5) and 14.3 days for sphingomab treated tumors. The sphingomab group was significantly different from both the vehicle treated (p = 0.036) and the isotype control treated (p = 0.032). The vehicle and isotype treated groups were not significantly different from each other (p = 0.786)
(Right) Vehicle and isotype tumors increased in length more quickly than those treated with sphingomab (F2, 12 = 10.513, p = 0.002). Average time to +2mm was 5.0 days in both the vehicle and isotype treatments (n = 5 and 3 respectively). Time to +2mm averaged 15.29 days in the sphingomab group (n = 7).

