
Figure 2.
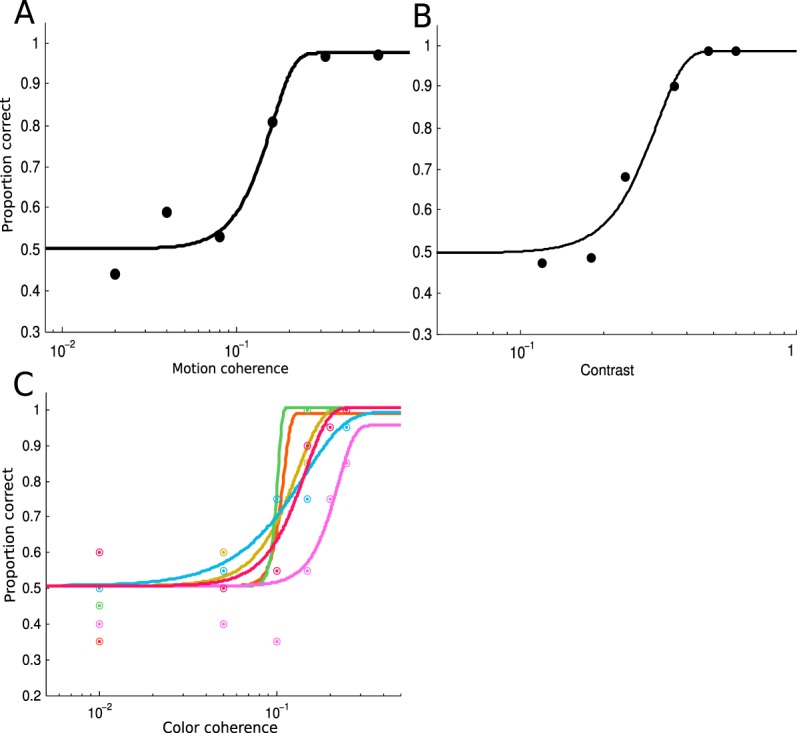
Threshold data from the training sessions of the three experiments. Data from a representative subject from each experiment is plotted. Solid lines are Weibull fits of the psychometric functions. (A) Threshold data from Experiment 1. (B) Threshold data from Experiment 2. (C) Threshold data from Experiment 3, in which we separately measured threshold for each of the six colors, coded by the color of the symbols and lines (see Figure 6B). Threshold data are noisier in the color experiment, presumably due to a smaller number of trials per color.