
Figure 3.
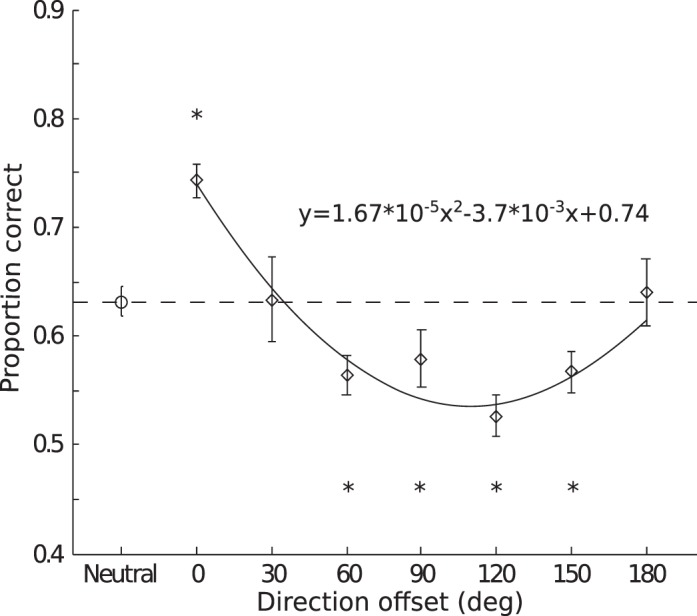
Results for Experiment 1. Group averaged accuracy as a function of the cue-to-target offset in direction. Error bars are the estimated within-subject standard error following the method of Loftus and Masson (1994). Asterisks indicate the significance level in paired t tests (*p < 0.05). The solid line is a quadratic fit of the average accuracy in the cued trials as a function of direction offset.