
Figure 7.
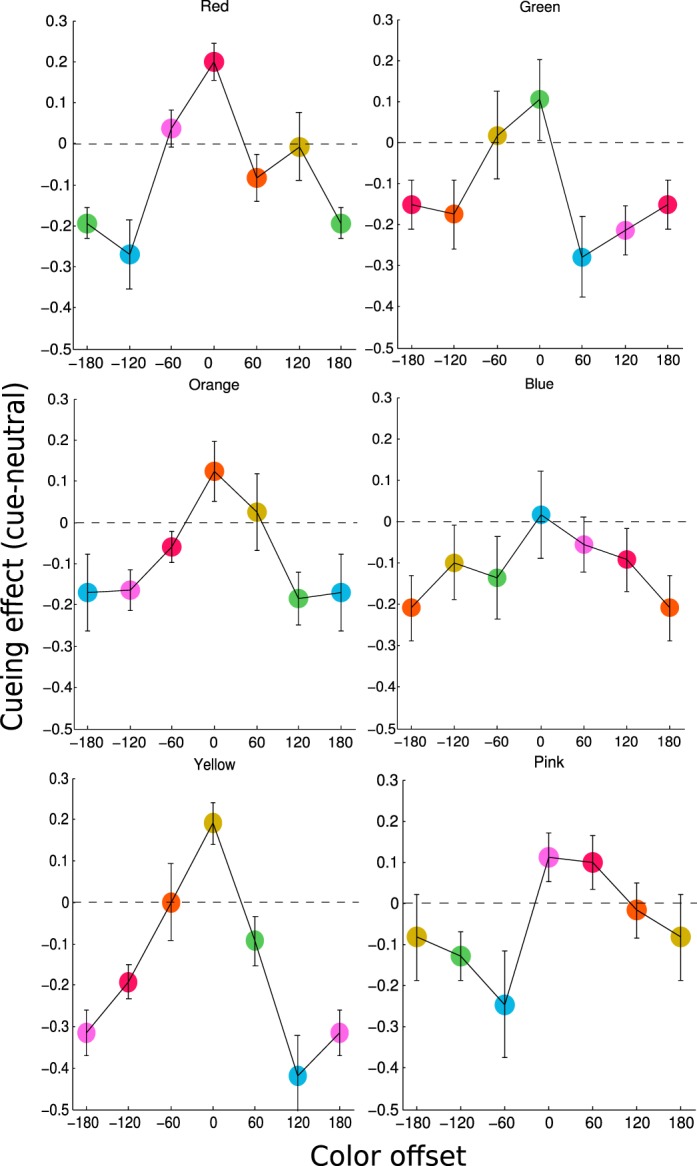
Results for individual cued colors in Experiment 3. Each panel plots the group averaged cueing effect, defined as performance difference between cued versus neutral trials for a particular cued color. The color of the target stimuli was shown as the color of the plot symbol, with the color at 0° as the cued color. Error bars are the estimated within-subject standard error.