
Figure 8.
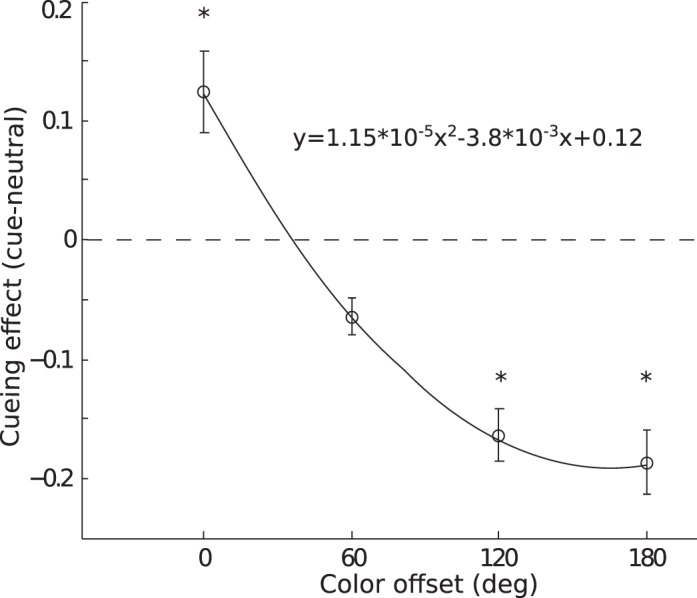
Results for Experiment 3, collapsed across individual cued colors, showing cueing effect as a function of the cue-to-target offset on the color circle. Other notations are the same as in Figure 2. The solid line is a quadratic fit of the cueing effect as a function of color offset.