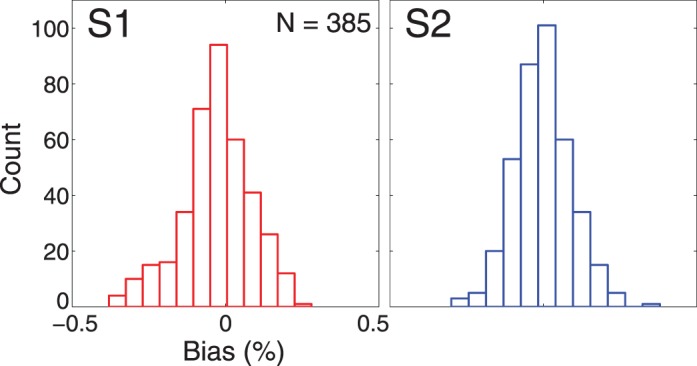
Figure 3.

Histogram of monitor bias measure for both subjects (n = 385). Monitor bias is defined as the difference between SM1 chosen and SM2 chosen (in percentage) for each stimulus when the positions of SM1 and SM2 were reversed. A monitor bias of 0.0 indicates no bias for SM. The monitor bias measure for both subjects is normally distributed around 0. For Subject 1: mean bias = −0.03, median bias = −0.02. For Subject 2: mean bias = −0.002, median bias = 0.00.
