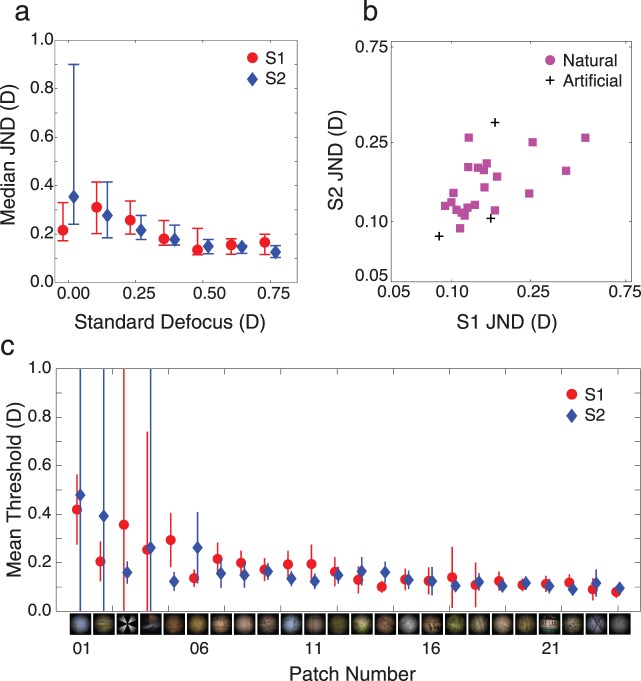
Figure 5.
Results of Experiment 1. (a) Median thresholds (75%) in diopters across all 24 stimuli for both subjects. Error bars represent the first and third quartile of the data. Threshold variability decreased with higher standard defocus levels, and defocus discrimination sensitivity increased. This effect is more pronounced in Subject 2 (blue diamonds) but is still present in Subject 1 (red circles). Both subjects were shown the same standard defocus levels. Data points are offset in this figure to improve legibility. (b) Correlation between discrimination thresholds. Plotted is the weighted average threshold for each stimulus over the last three standard defocus levels (0.500, 0.625, and 0.75 D) for each subject. A log–log axis was chosen because confidence intervals on thresholds are roughly equal in log–log space. Thresholds were moderately correlated between subjects (0.55, p = 0.005). The Spearman rank correlation between thresholds was 0.55 (p ≪ 0.01). (c) Mean thresholds in diopters as a function of patch for each subject. Patches are ordered here, and in Figure 1, by average threshold between subjects from high to low. The Maltese cross, a standard accommodative stimulus, is among stimuli for which thresholds were highest (i.e., blur was hardest to discriminate). The random dot stimulus produced the lowest thresholds. No obvious relationship exists between image content and discrimination performance.

