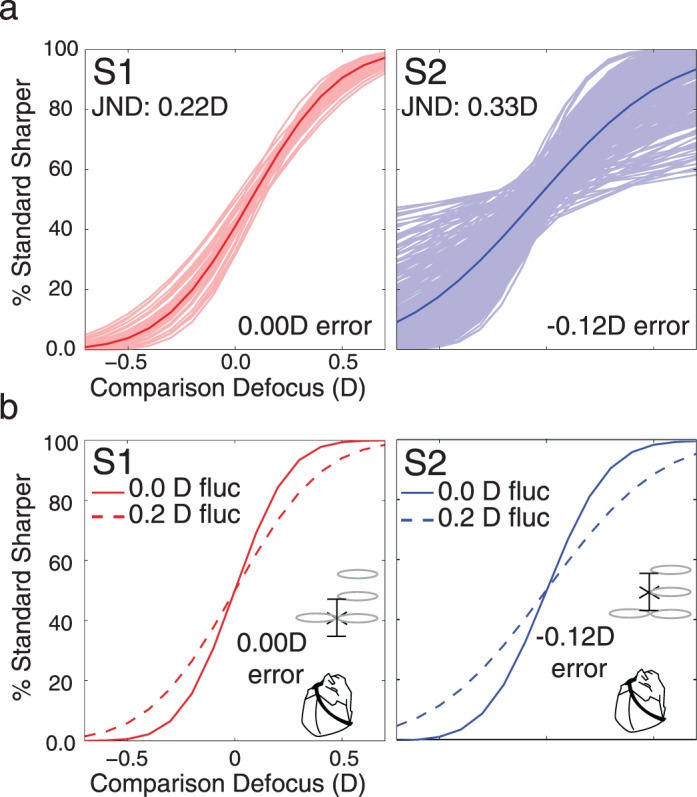
Figure 6.

Effect of accommodative fluctuations on defocus discrimination thresholds. (a) Simulated psychometric functions. The shaded lines are 1,000 simulated psychometric functions at a standard of 0.00 D using the focus bias corresponding to each subject (0.00 D for Subject 1 and −0.12 D for Subject 2). The solid lines are the aggregate psychometric functions. The psychometric functions of Subject 2 showed more variability because of the negative focus error. (b) Simulated psychometric functions for 0.0 D and 0.2 D accommodative fluctuations. Each function represents 1,000 simulations. The threshold for Subject 2 increased more than for Subject 1 because Subject 2 had a focus error.
