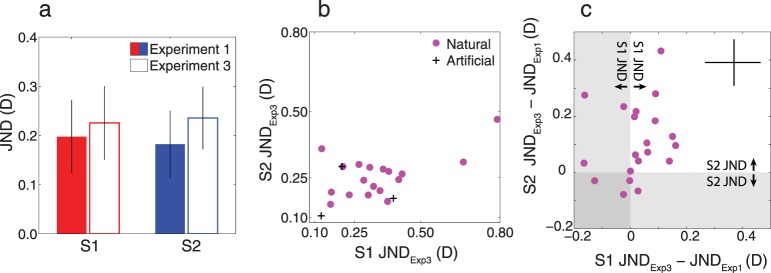
Figure 8.

Experiment 3 results. (a) Mean threshold at standard defocus of 0.375 D collapsed across stimuli for Experiments 1 and 3 with bootstrapped 95% confidence intervals. Thresholds increased slightly for both subjects but were not significantly different. (b) Subject 2 JND from Experiment 3 versus Subject 1 JND from Experiment 3. Thresholds are correlated between subjects when contract energy is equalized (0.67, p = 0.0002). (c) The difference in the thresholds for each stimulus between Experiments 1 and 2 for Subject 2 versus the difference in thresholds for Experiments 1 and 3 for Subject 1. The difference is correlated between subjects (0.57, p = 0.004). The bars in the upper right corner represent the average 95% confidence intervals for all points.
