
Figure 10.
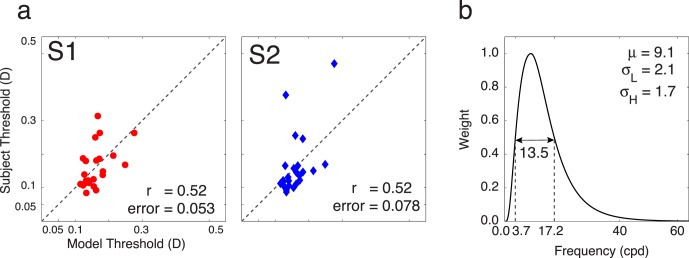
Model results. (a) Subject thresholds for blur discrimination versus predicted thresholds for blur discrimination. The correlation between predicted thresholds and subject thresholds is 0.52 for both subjects. Recall that the between-subjects correlation is 0.55. The model predicts threshold variability as well as each observer predicts each other. (b) Log Gabor weighting function on frequencies. The peak is at 9.1 cpd, and the bandwidth is 13.57.