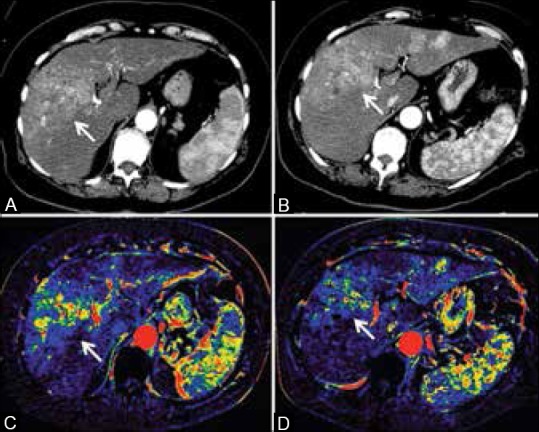
Figure 5 (A-D).

CECT images ((A) Baseline, (B) Post-treatment) and perfusion (blood volume) maps ((C) Baseline, (D) Post-treatment) of a 73-year-old woman with HCC. CTP demonstrated perfusion changes (–34% in blood volume) without significant changes in size and density after 2 weeks of antiangiogenic treatment
