Figure 6 (A and B).

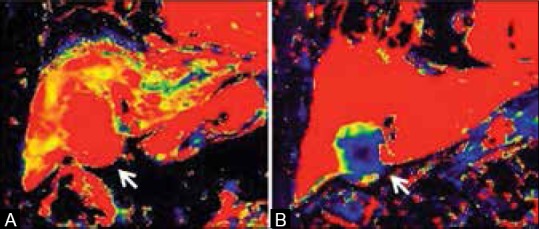
Ktrans maps of a 69-year-old man with HCC at baseline (A) and at 2 weeks after tyrosine kinase inhibitor therapy (B). Ktrans of the tumor showed 79.8% reduction after the therapy, while the change in tumor size was not obvious

Ktrans maps of a 69-year-old man with HCC at baseline (A) and at 2 weeks after tyrosine kinase inhibitor therapy (B). Ktrans of the tumor showed 79.8% reduction after the therapy, while the change in tumor size was not obvious