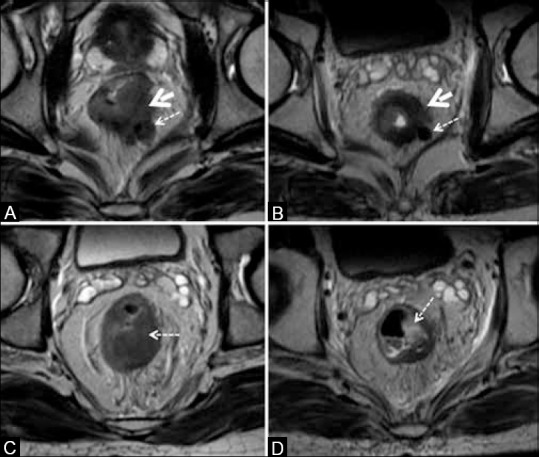
Figure 21.

Tumor response. (A and B) The tumor (solid arrows) and node (dashed arrows) with intermediate signal in (A) show darkly hypointense signal in (B); both regressed in size. (C and D) Nonmucinous tumor (arrow) in (c) shows mucinous degeneration seen as hyperintense focus (arrow) in (D)
