Figure 5.

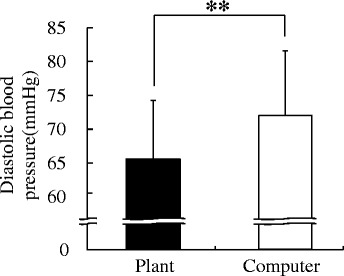
Comparison of diastolic blood pressure after the plant and computer tasks. N = 24, mean ± SD, **P < 0.01 (paired t test).

Comparison of diastolic blood pressure after the plant and computer tasks. N = 24, mean ± SD, **P < 0.01 (paired t test).