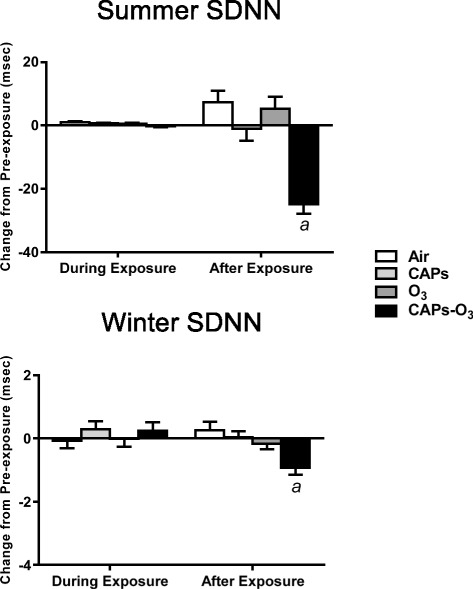
Figure 6.

Mean change in SDNN from pre-exposure values during summer and winter exposures. SDNN values for each animal at each time point during exposure or after exposure were subtracted from corresponding time-matched pre-exposure baseline data, which was recorded while the animals were either in the chamber (for “during exposure” data) or in their home cages (for “after exposure” data). Values represent mean change in SDNN in msec ± standard error of the mean (n = 6). a - significantly less than filtered air control (p < 0.05).
