
Figure 3. Abundance of metazoans (>250 μm) at stations around Lihir.
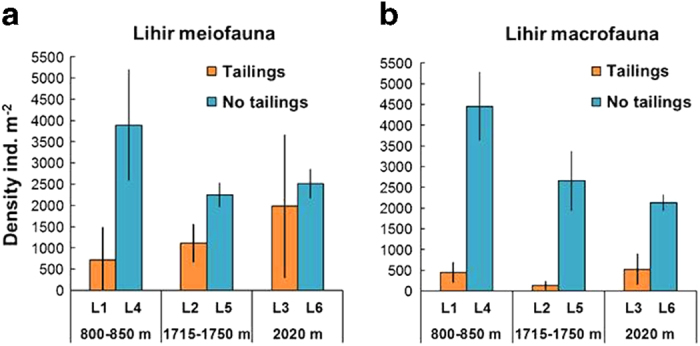
Bars represent means (±SD) of replicate corer drops (n = 3–7 drops station−1, see Supplementary Table S1), with densities standardised to individuals m−2. Depth-matched tailings and reference (no tailings) stations are shown in adjacent bars.