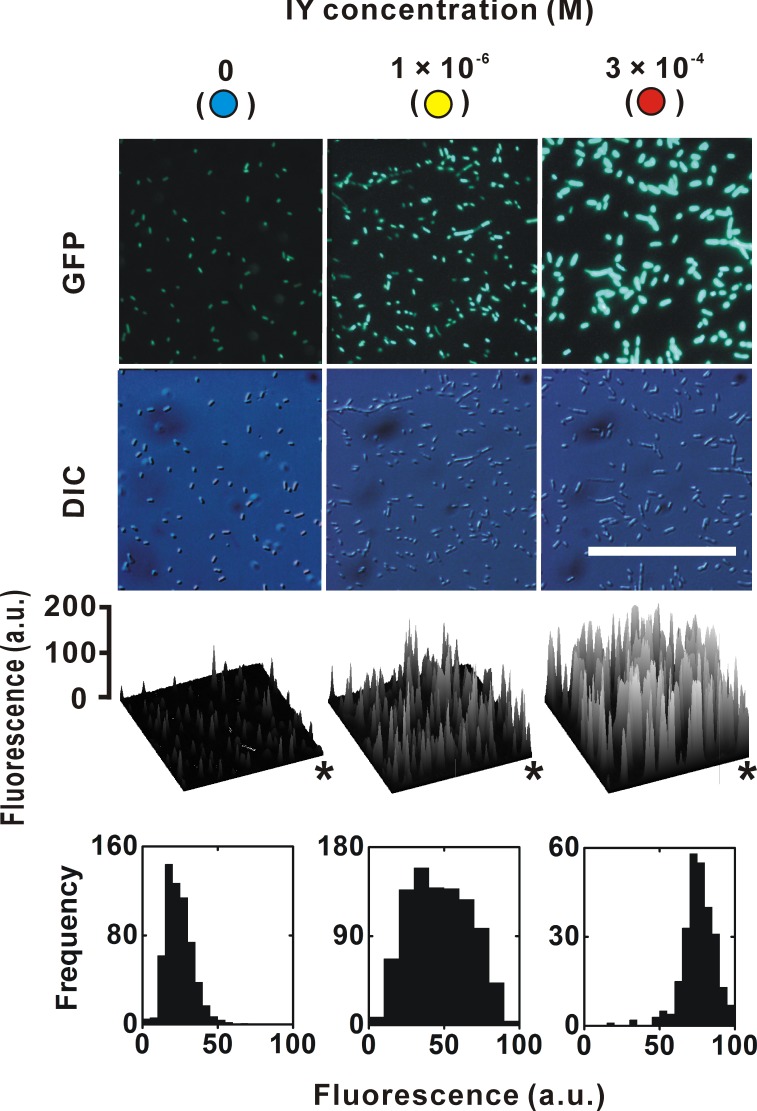
Figure 3. EGFP expression in individual bacteria.
The sampling points are indicated in the dose-response curve in Fig. 2A. Upper and lower photographs are epifluorescence images and Nomarski differential interference contrast images, respectively. The photographic conditions were constant for all of the fluorescence images. Calibration bar = 100 µm. Asterisks in spatial distribution graphs indicate the upper right corners of the fluorescence images. The frequency in the histograms indicates the number of individual bacteria.

