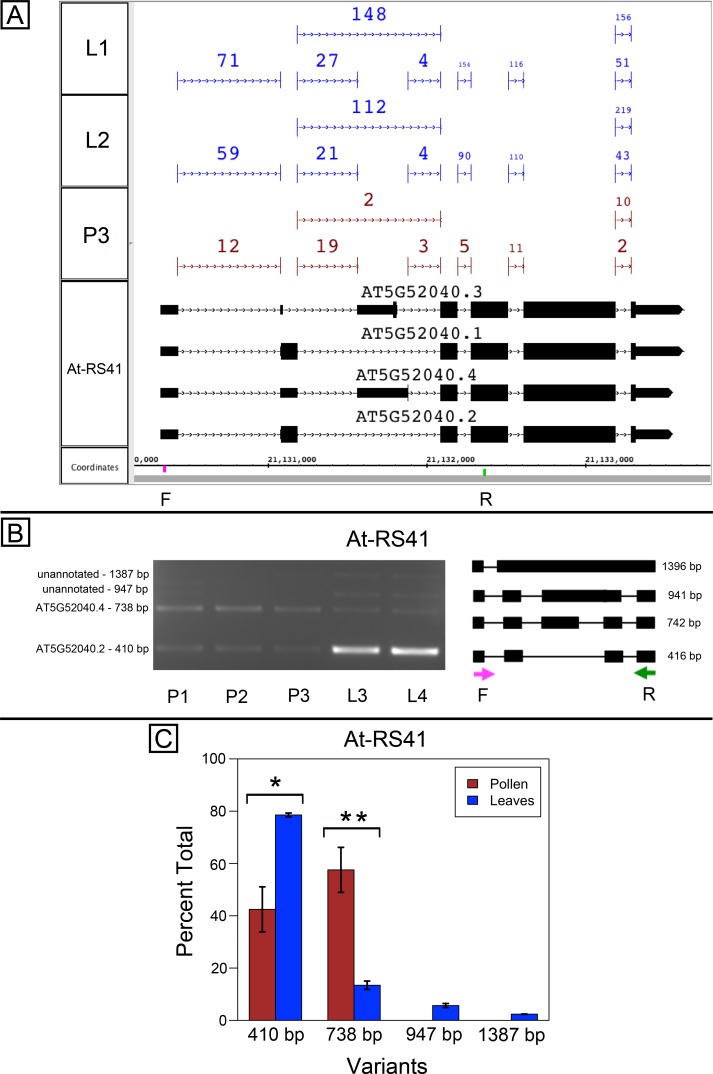
Figure 2. Pollen-specific splicing in At-RS41.
(A) Junction features from RNA-Seq reads for leaf (L1, L2) and pollen (P3) samples alongside annotated gene models. Numbers indicate how many spliced reads supported the indicated junction in pollen and leaf RNA-Seq libraries. Primers used in semi-quantitative PCR are shown. Primer sequences were GAGAGCCTCGAAGAAAGCAA (F) and TGCATCGAAGTTGATCACAA (R). (B) Gel electrophoresis of PCR amplification of pollen (P1, P2, P3) and leaf (L3, L4) cDNAs and corresponding model of alternative splice variants. Estimated fragment size from gel and theoretical fragment size based on splice model found to left and right, respectively, in base pairs (bp). (C) Percent total of each observed splice variant in pollen and leaf samples quantified from gel electrophoresis in (B). Values are averages of replicate samples. Error bars indicate two standard deviations. Asterisk indicates p-value less than 0.05, double asterisk less than 0.01.

