
Fig. 3.
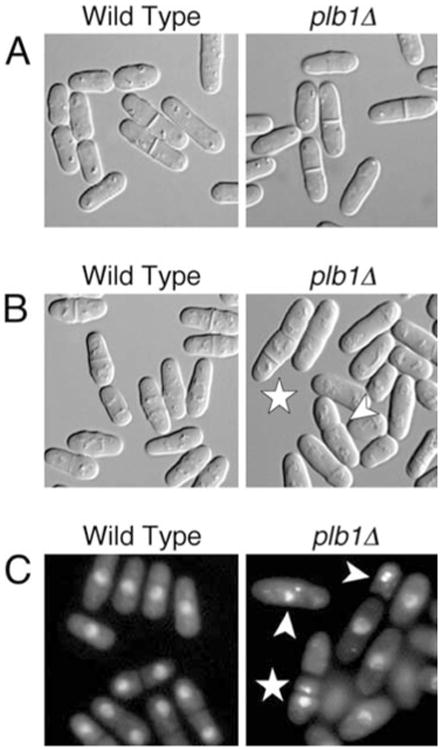
A–C Microscopic analysis of the plb1Δ mutant. A Photomicrographs of wild-type (left) and plb1Δ (right) cells grown in YEAU to mid-log phase. Wild-type cells divided at an average cell length of 15.6 μm, while plb1Δ cells divided at an average length of 13.3 μm. B Wild-type (left) and plb1Δ (right) cells were grown in YEAU to mid-log phase, then subcultured into YEAU containing 1.2 M KCl and incubated for 18 h prior to microscopy. Arrowheads point to cells with misplaced and/or multiple septa. C Wild-type and plb1Δ cultures treated as in B were stained with DAPI to visualize nuclei by indirect fluorescence microscopy. Arrowheads point to cells with hypercondensed (intense, compact nuclear signal) and/or fragmented nuclei. The star indicates a cell in which the nucleus has been cut by the septum. This same cell also has two septa, and one of the three cell compartments lacks a nucleus