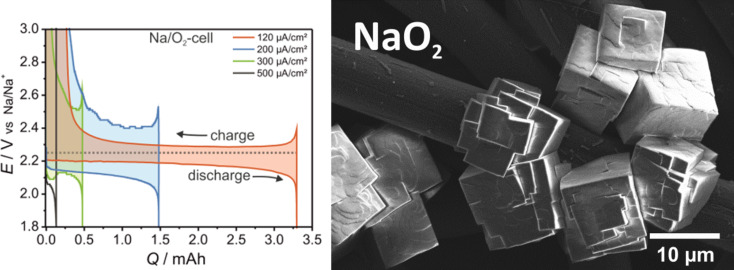
Figure 11.
Discharge/charge curves (Type 1B) of a sodium–oxygen battery with NaO2 as discharge product. The main differences compared to Li/O2 cells are that only small overpotentials are observed and that the crystallite size of the discharge product is much larger (see SEM image on the right) [109].

