Figure 1.

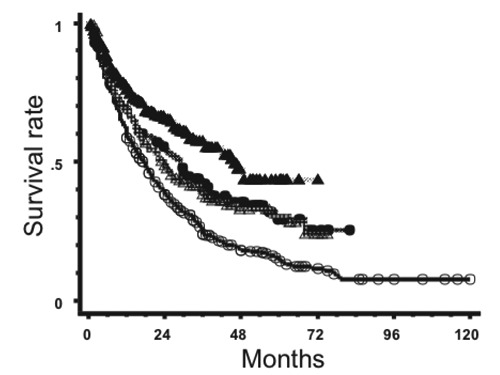
Survival curves for primary central nervous system lymphoma patients treated during 1985-1994 (○, n=466), 1995-1 1999 (●, n=142), 2000-2004 (△, n=131) and 2005-2009 (▲, n=304).

Survival curves for primary central nervous system lymphoma patients treated during 1985-1994 (○, n=466), 1995-1 1999 (●, n=142), 2000-2004 (△, n=131) and 2005-2009 (▲, n=304).