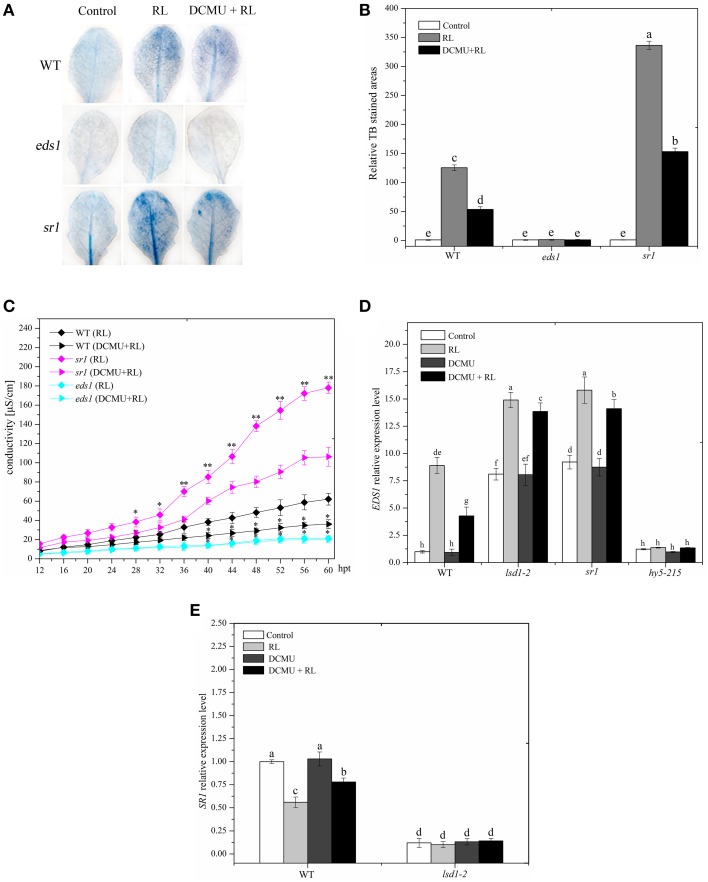
Figure 6.
EDS1 is in response to RL-induced PCD and its expression is controlled by LSD1 and HY5. (A) Trypan blue staining of four-week-old leaves of WT, eds1 and sr1 mutant after control, RL, and DCMU + RL treatment. (B) Areas of TB-stained foliar tissues in WT, eds1 and sr1 mutant as described in (A). (C) Relative ion leakage was detected and showed the extent of cell death. Asterisks indicate significant differences between the wild type and the mutants (Student's paired t-test: *P < 0.05, **P < 0.01). (D) qRT-PCR showing the relative expression of EDS1 gene in WT, hy5-215,lsd1-2 and sr1 mutant exposed to control, RL, DCMU and DCMU + RL. (E) qRT-PCR determination of SR1 mRNA levels in WT and lsd1-2 mutant exposed to control, RL, DCMU, and DCMU + RL. Each data is the mean ± SD of three independent replicates. Different letters indicate statistically significant differences between treatments (Duncan's multiple range test: P < 0.05).

