Figure 5.
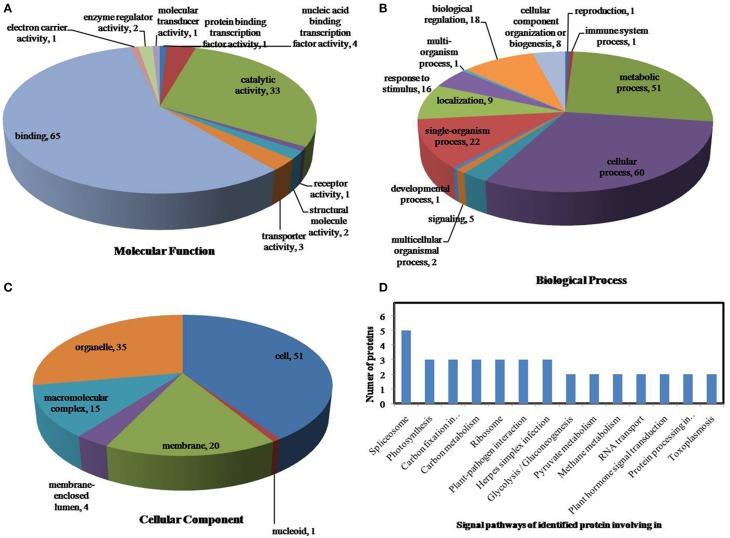
Pie charts of the distribution of differentially phosphorylated proteins based on their predicted molecular functions (A), biological process (B), and cellular components (C), and the signaling pathways (D) of the proteins identified as involved in drought stress. There were 160 proteins identified under drought stress in this study, and they were classified according to their known or predicted cellular localization using Blast2Go (http://www.blast2go.com).

