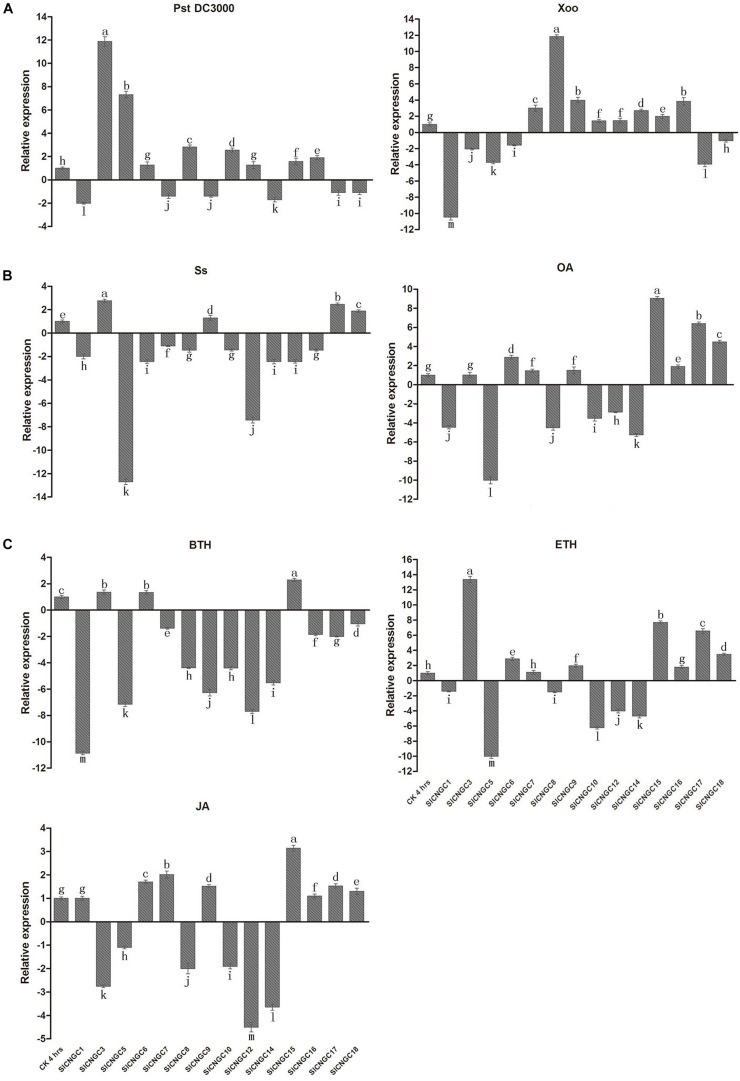
FIGURE 3.
Expression profiles of 14 SlCNGC genes. Expression profiles of the SlCNGC genes in response to Pst DC3000 and Xoo inoculation (A), oxalic acid (OA) treatment and Ss inoculation (B) and hormone treatments (C) were detected by qRT-PCR with the gene-specific primers listed in Supplementary Table S1. The small letters indicated the significant difference among expression level of the SlCNGC genes in treated samples and non-treated CK and data represent the mean ± SE of three independent experiments (p < 0.05, DMRT).

