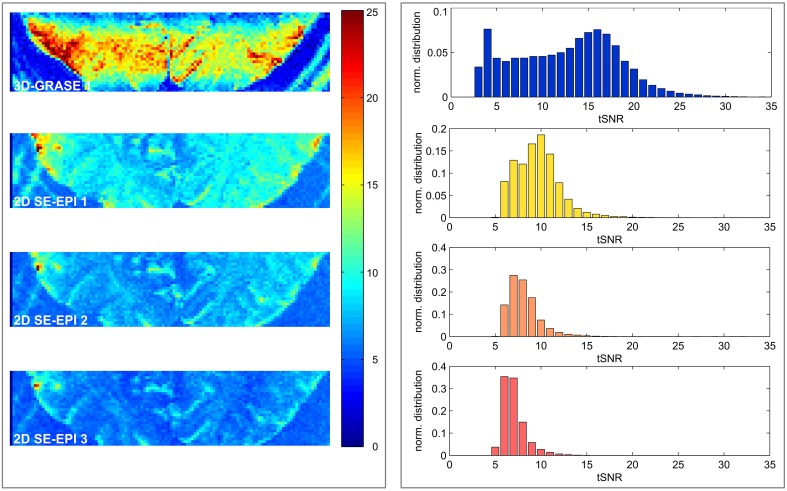
Figure 4.
Temporal signal-to-noise-ratio maps. Maps of the five different acquisitions in a single subject (left) and corresponding histograms (right) are displayed. The 2D SE-EPI images are cropped to the same FoV as 3D-GRASE 1. All maps have the same color scale. Histograms display the tSNR distribution of the same in-plane FoV in all 3D-GRASE slices and 2D SE-EPI slices corresponding to 3D-GRASE 1.

