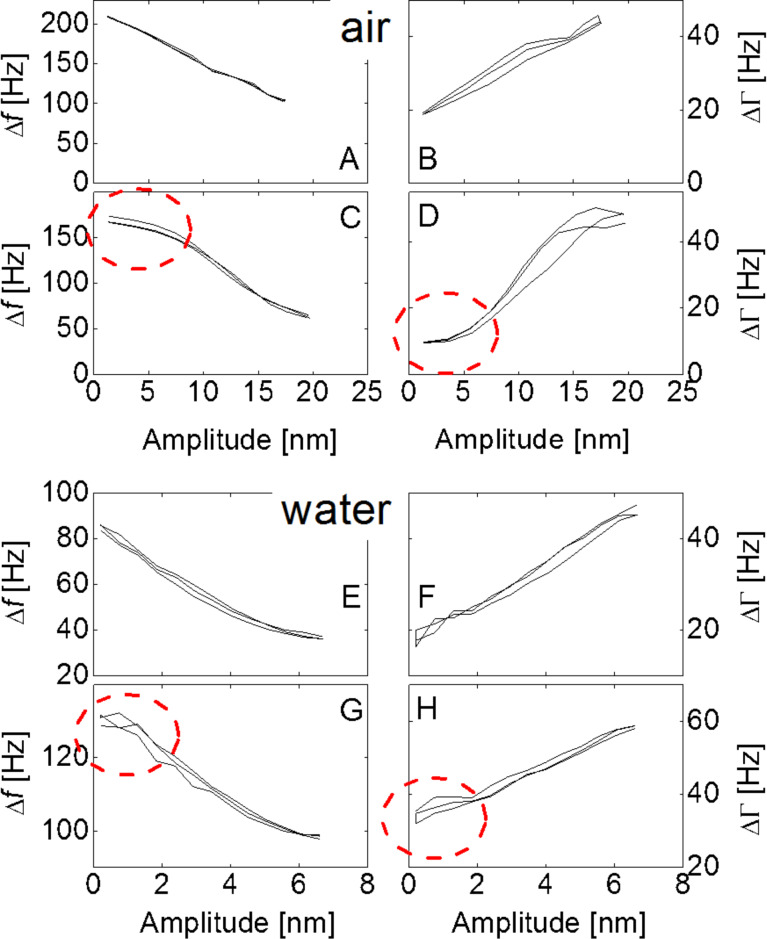
Figure 4.
Data traces of frequency shift, Δf, and bandwidth shift, ΔΓ, versus amplitude of oscillation. All data sets contain four amplitude sweeps. Data shown in the four panels at the top and the four panels at the bottom were acquired in air and in water, respectively. In liquids, the maximum achievable amplitude is lower than in air because of damping. Δf and ΔΓ decrease and increase with amplitude, respectively, as is characteristic for partial slip. Panels A, B, E, and F show typical data traces. In these cases, the amplitude dependence is linear. Occasionally, one also finds plateaus at small amplitudes (dashed ellipses in panels C, D, G, and H). In these cases, the edge of the contact sticks at small amplitudes, where the exact conditions, under which such a stick occurs, are unclear. Even in these cases, the frequency–amplitude traces are clearly not parabolic (which should result if the Savkoor model was applicable).

