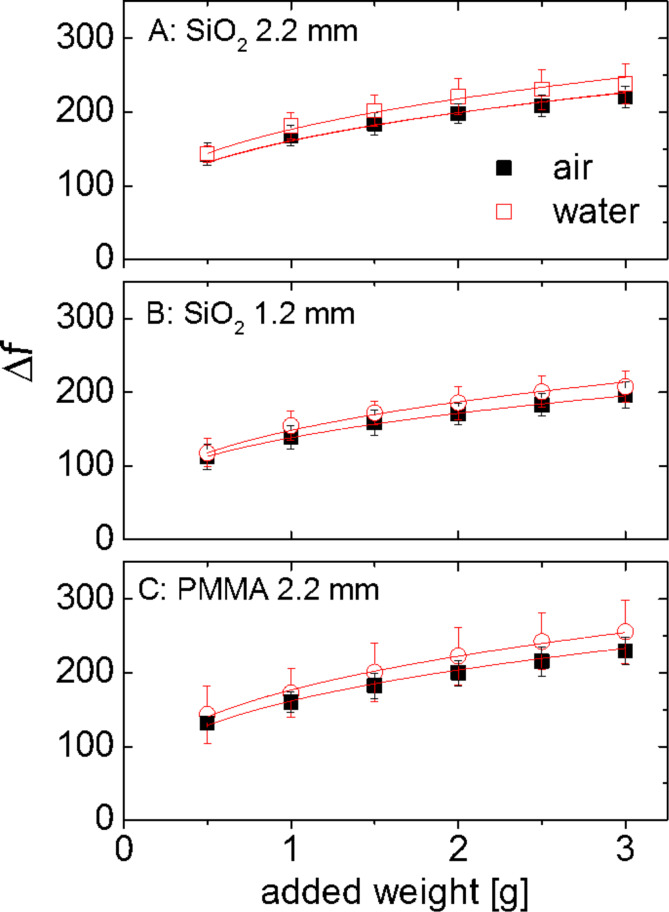
Figure 5.
Frequency shifts in the low-amplitude limit obtained on silica surfaces (A and B) and on a PMMA surface (C). All data shown are averages from 9 experiments. Error bars are standard deviations. Dotted lines show JKR fits with parameters as given in Table 1.

