Figure 2.
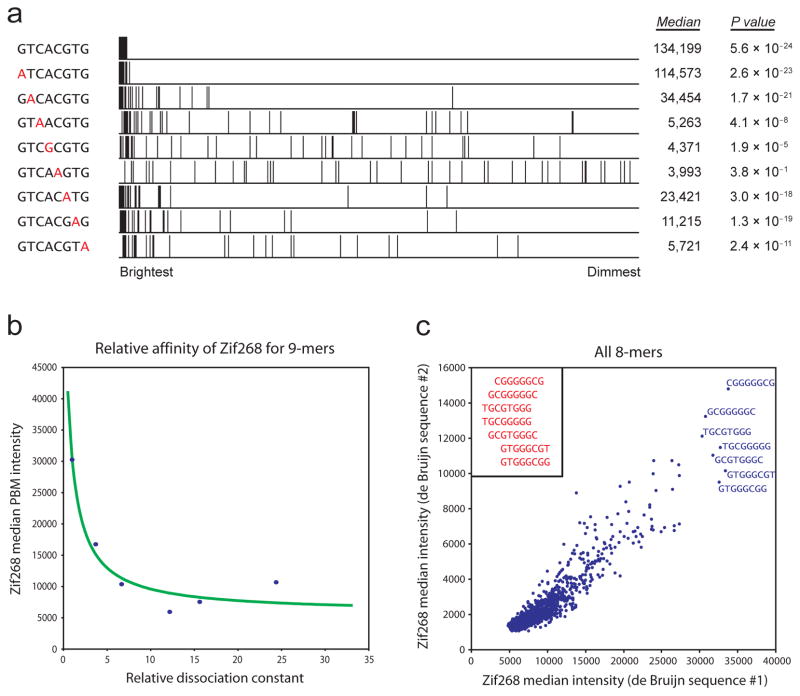
Relating PBM signal intensity to individual k-mers. (a) Enrichment of different Cbf1 binding site variants. All spots are ranked in descending order by their normalized signal intensities, and spots containing a match to each specified 8-mer are marked. For each 8-mer, the median intensity over all such spots is shown (in fluorescence units), as is the P value for enrichment as calculated by the Wilcoxon-Mann-Whitney test. (b) Correspondence between signal intensity and binding affinity. The median intensities for six 9-mer binding site variants for the mouse TF Zif268 are plotted against their relative dissociation constants as measured by a quantitative binding (QuMFRA) assay9. Data points are fit as described previously2, with the addition of a constant term for nonspecific binding. (c) Correspondence between separate PBM experiments performed on microarrays constructed with independent de Bruijn sequences. The median intensity for spots containing a match to each 8-mer is shown for each experiment. As evident here, the PBM data are consistent not only for the highest-affinity k-mers but also for the moderate- and low-affinity k-mers. The observed correlation for 8-mers (R2 = 0.803) is only slightly weaker than for 7-mers (R2 = 0.890; Supplementary Fig. 6) yet considerably stronger than for 9-mers (R2 = 0.525). Each non-palindromic 8-mer is present on at least 32 spots, compared to 128 and 8 spots for 7-mers and 9-mers, respectively. Differences in the absolute scales reflect differences in scanning intensities. The highest-affinity k-mers are labeled and manually aligned (inset).

