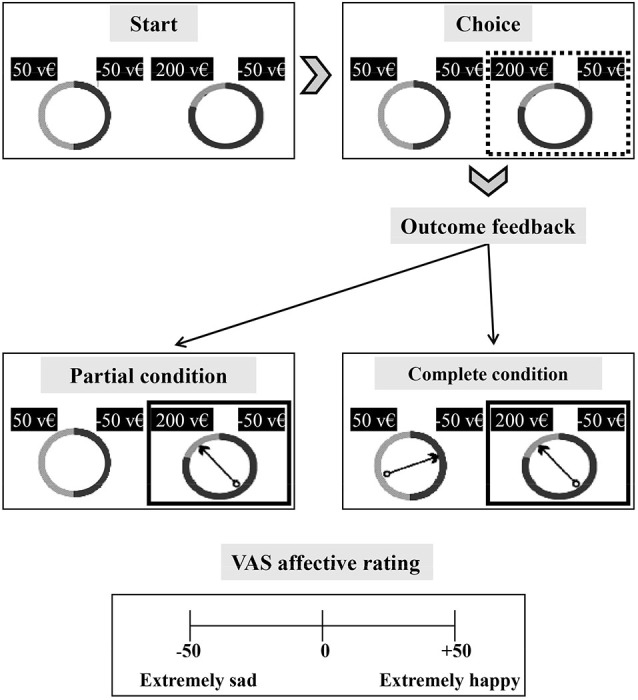
Figure 2.

Schematic of the regret gambling task. Each subject was required to choose the more advantageous alternative between two wheels of fortune shown on a monitor. Each wheel (upper part of the figure) has 2 sectors associated with different value pairs. Possible outcomes are formed by any pair of combinations of the following values: 50, −50, 200, −200 (virtual money—v€) and are indicated above the wheel. Each value is randomly associated with one of three outcome probabilities (0.8, 0.2, 0.5). The length of each segment (gray and black segments) indicates the outcome probability. In the choice phase, the subject selects one of two wheels, and a rectangular box appears around the selected wheel (upper right of the figure). In the outcome phase of the partial condition blocks, a spinning arrow appears only in the selected wheel and stops in 1 of the 2 segments. Only the outcome of the selected wheel can be seen (middle left of figure). In the outcome phase of the complete condition blocks, a spinning arrow appears in both the selected and unselected wheels. The arrows rotate and stop, allowing the subject to view the outcomes of both wheels (middle right of figure). At the end of each trial, the subject has to rate his affective state by visual analogical scale (VAS) rating from –50 (extremely sad) to 50 (extremely happy) (lower part of the figure).
