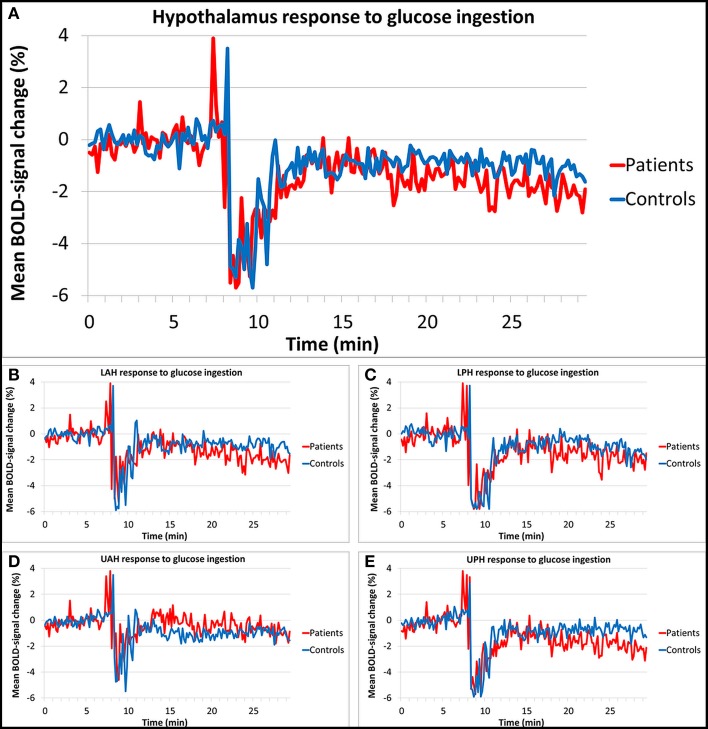
Figure 3.
Relative BOLD fMRI signal change of the hypothalamus in response to glucose. The hypothalamic BOLD response showed a decrease of 1.4% in patients and a decrease of 1.0% in controls after glucose ingestion, no significant differences in response were found between groups. Segmentation of the hypothalamus into four subdivisions showed similar results. (A) Total hypothalamus, (B) lower anterior hypothalamus (LAH), (C) lower posterior hypothalamus (LPH), (D) upper anterior hypothalamus (UAH), (E) upper posterior hypothalamus (UPH).

