
Figure 4.
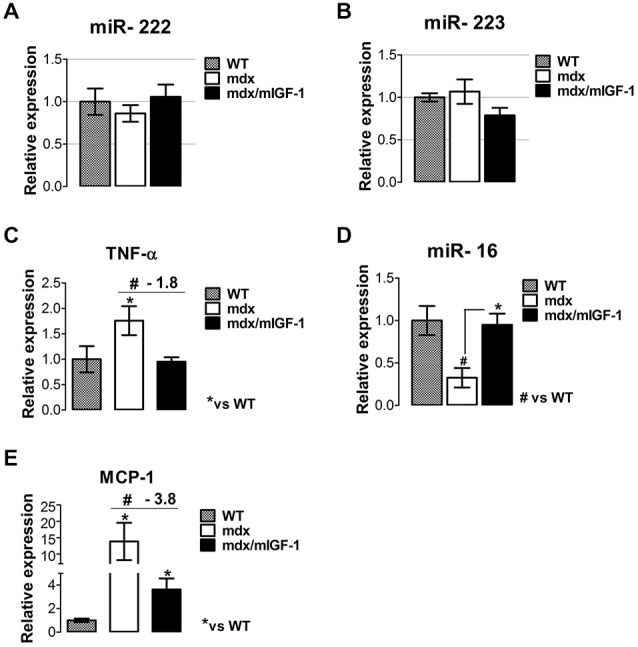
mIGF-1 modulates factors associated with the inflammatory response in dystrophic muscle. (A,B) Graphs show inflammatory -miR-222 (A) and miR-223 (B) expressions analyzed by qRT-PCR in diaphragm muscles from WT, mdx, and mdx/mIGF-1 mice at 4 weeks of age. Relative expressions were normalized to U6 snRNA and shown with respect to WT set to a value of 1. Values represent mean ± SEM; n = 5–7 per group. (C) Expression of TNF-α evaluated by real time PCR analysis, in diaphragms of indicated genotypes at 4 weeks of age. Relative expressions were normalized to HPRT1 and shown with respect to WT, set to a value of 1. Values represent mean ± SEM; n = 5–7 per group. *p < 0.05, #p < 0.05 by one way ANOVA. (D) miR-16 expression measured by qRTPCR in diaphragm of 4-week-old WT, mdx and mdx/mIGF-1 mice. Relative expressions were normalized to U6 snRNA and shown with respect to WT set to a value of 1. Values represent mean ± SEM; n = 5–7 per group. *p < 0.05, #p < 0.05 by one way ANOVA. (E) Relative expression analysis for MCP-1, measured by real time PCR in diaphragms of indicated genotypes at 4 weeks of age. Relative expressions were normalized to HPRT1 and shown with respect to WT, set to a value of 1. Values represent mean ± SEM; n = 5–6 per group. *p < 0.05, #p < 0.05 by one way ANOVA.