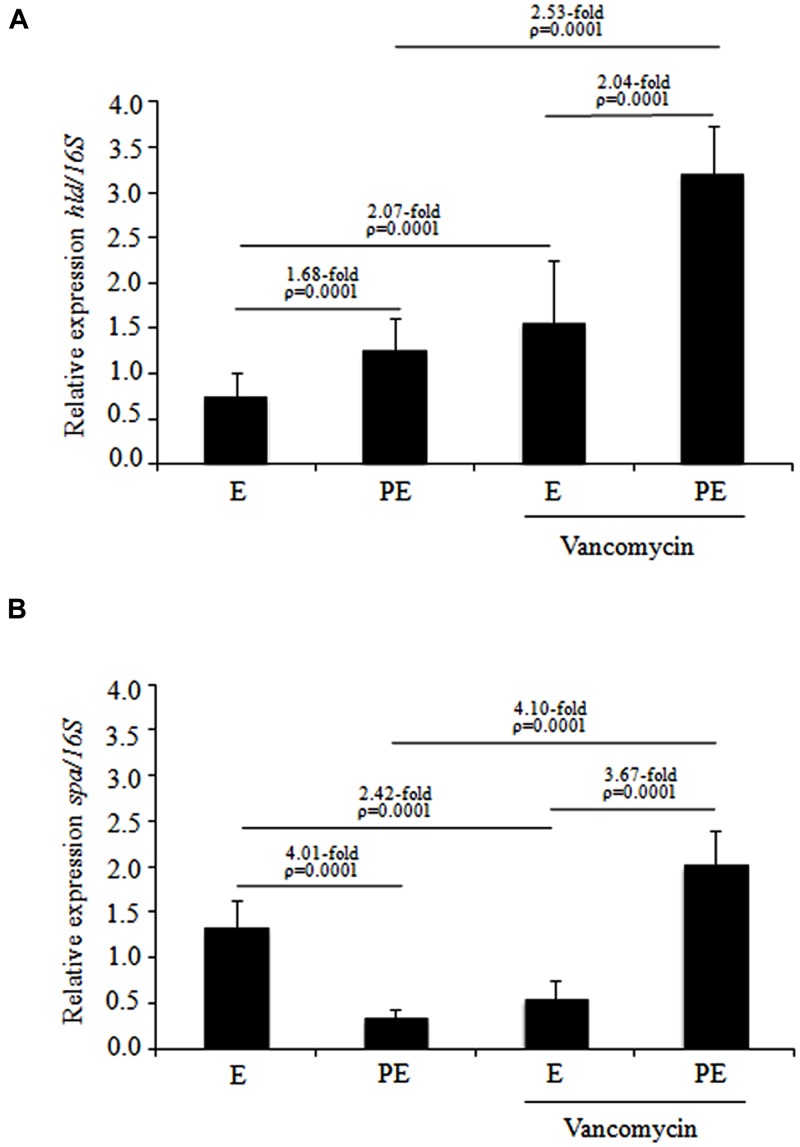
FIGURE 3.
Expression levels of the hld and spa genes determined by RT-PCR in MDR S. aureus clinical isolates cultured from the exponential to post-exponential growth phases in the presence of vancomycin. (A) hld expression; (B) spa expression. The densitometric results of the transcripts were quantified using the Quantity One program and analyzed by paired Student’s t-tests. E, exponential; PE, post-exponential.

