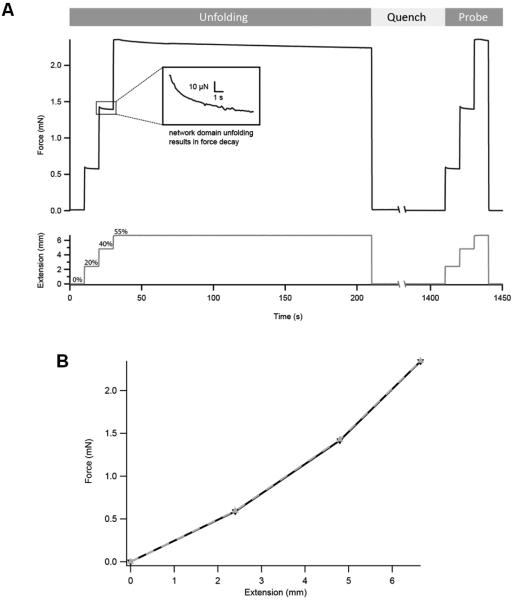
Figure 4. Stress relaxation experiments with I918 protein hydrogels.
(A) Force trace output (black), along with the corresponding extension protocol (gray). % strain values are indicated. Notice the sequential stress relaxation curves during the unfolding pulse, suggesting the force-triggered unfolding of domains forming the network of the gel. (B) Plot showing initial force generated at each extension step in both the unfolding (black, solid) and probe (gray, dashes) pulses. Both traces overlap to a large extent.

