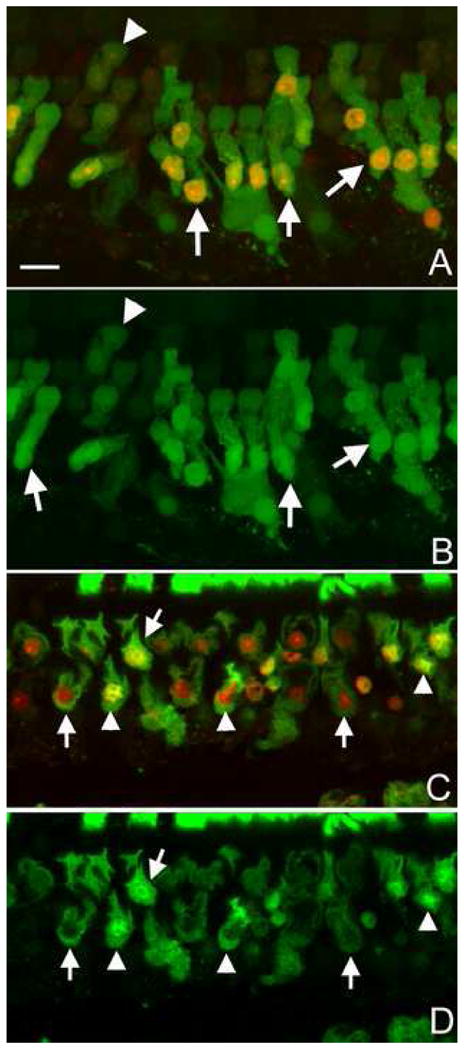
Figure 6.

Membrane leakage assessed by FITC-Dx labeling following exposure to the noise. A and B: Images of the 3 kDa FITC-Dx fluorescence (green) with the PI fluorescence (A) or without the PI fluorescence (B). Arrows indicate PI-stained cells. These cells also exhibit a strong FITC-Dx fluorescence. The arrowhead indicates a hair cell lacking the PI fluorescence. This cell has a weak FITC-Dx fluorescence. The FITC-Dx presents in both the cytosol and the nuclei. C and D: Images of the 40 kDa FITC-Dx fluorescence with the PI fluorescence (C) or without the PI fluorescence (D). Arrows indicate hair cells showing a strong FITC-Dx fluorescence in the cytosol. Arrowheads indicate the hair cells showing the FITC-Dx fluorescence in both the cytosol and nuclei. All the images show hair cells in the second cochlear turn. Bar: 20 μl.
