
Figure 7.
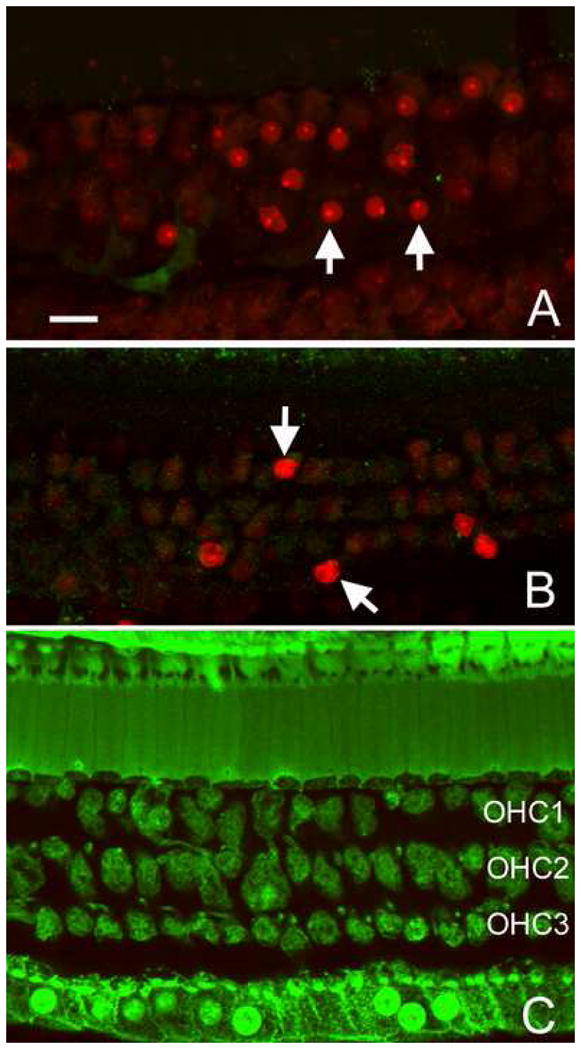
Absence of the fluorescence of FITC-Dx with large molecular sizes following the noise exposure. A: A typical image of a 500 kDa FITC-Dx and PI-doubly-stained organ of Corti. B: An image of a 2000 kDa FITC-Dx and PI-doubly-stained organ of Corti. Arrows indicate outer hair cells exhibiting a strong PI fluorescence in the nuclei. These cells lack the FITC-Dx fluorescence. C: 500 kDa FITC staining in an organ of Corti treated with the Triton X-100 solution. Note that all the hair cells and supporting cells show a strong FITC-Dx fluorescence. Bar: 15μl. OHC1, OHC2, and OHC3 indicate the first, second, and third rows of outer hair cells, respectively. The images show hair cells in the second cochlear turn.