Figure 1.

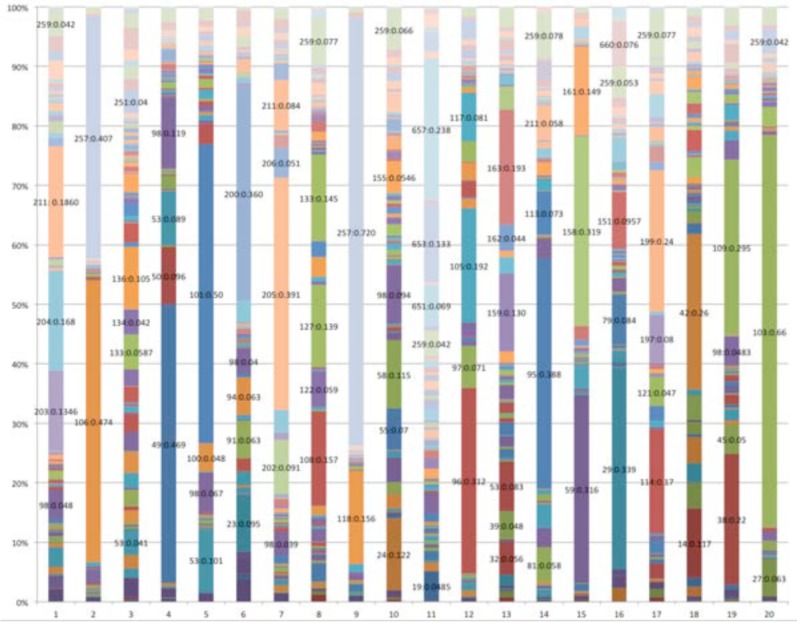
Diagnosis code group proportion for 20 topics where x-axis is the topic and y-axis is the proportion of each code group in that topic

Diagnosis code group proportion for 20 topics where x-axis is the topic and y-axis is the proportion of each code group in that topic