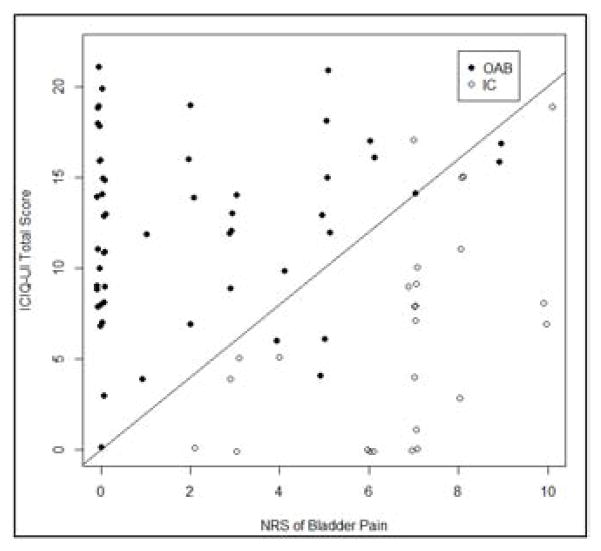
Figure 1.
Scatterplot of the distribution of OAB and IC/BPS patients. A hypothetical line with a slope of 2 was drawn in the scatterplot for reference. (X-axis = NRS of bladder pain symptoms 0 to 10, Y-axis = ICIQ-UI Short Form total score 0 to 21, solid circle = OAB, open circle = IC/BPS). Sensitivity of OAB = 90.6% and specificity = 96.1%.

