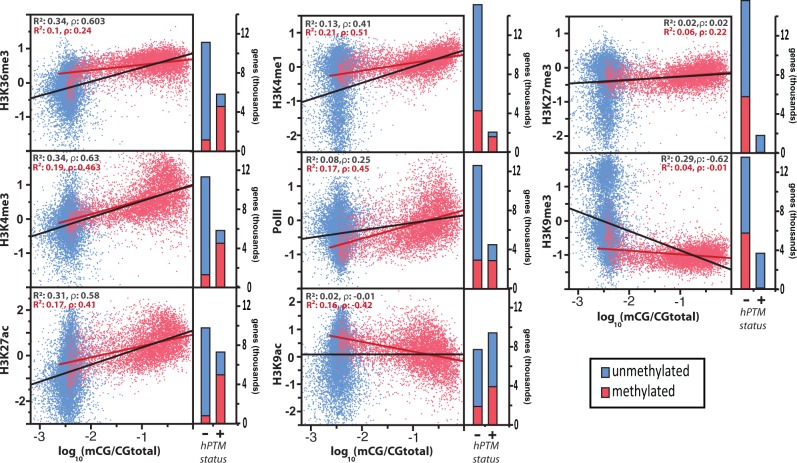
Fig. 1.—
Histone modification enrichment as a function of DNA methylation levels for methylated (red) and unmethylated (blue) genes. Linear fits for all genes (black line) and methylated genes only (red line) are provided, along with their relevant R2 values and Spearman’s correlations, ρ. Bars represent the number of genes belonging to each class: those with significant histone posttranslational modification (hPTM) enrichment (+) and those without (−).

