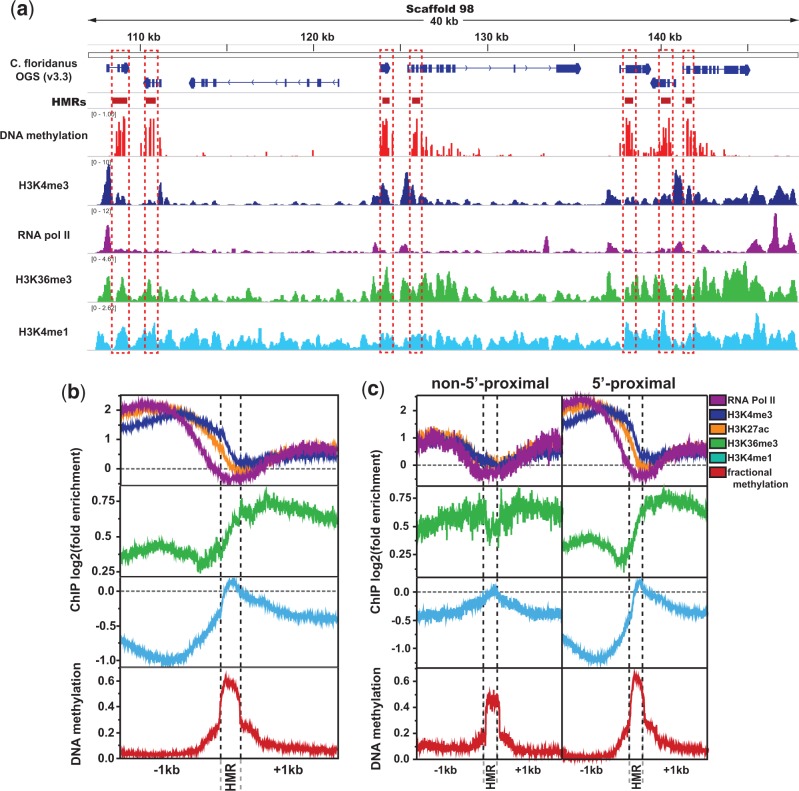
Fig. 3.—
Active histone modification enrichment significantly differs between HMRs and non-HMRs. (a) Example genome browser track showing stark spatial contrast between DNA methylation (HMRs) and promoter-proximal active chromatin (highlighted in red boxes). (b) Spatial relationship between DNA methylation and select histone posttranslational modifications or polymerases. (c) ChIP enrichment at HMRs separated by whether they fall within 1,200 bp of a gene start (“5′-proximal”) or not (“non-5′-proximal”). Significance values represent results of Kruskal–Wallis tests comparing HMRs and 500 bp regions in each direction of HMR boundaries. Repressive hPTMs showed little organization relative to HMRs, and were thus excluded.

