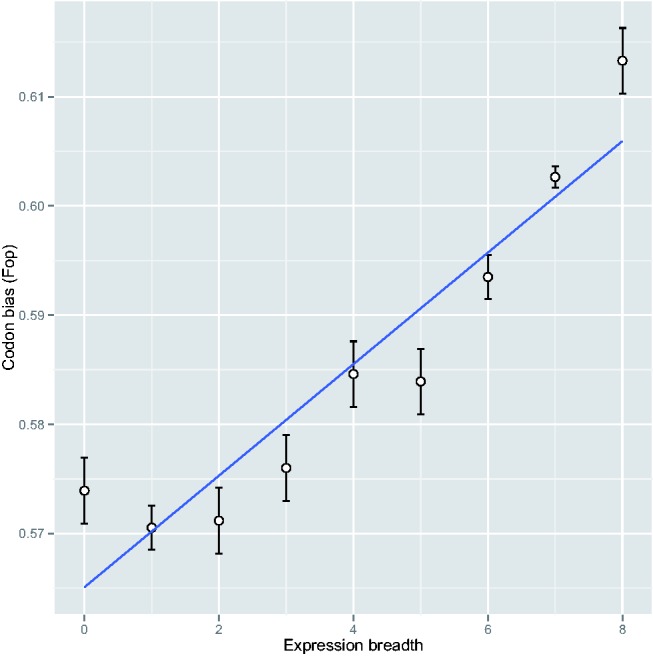
Fig. 1.—

Correlation between codon bias (Fop) and expression breadth in P. glauca. Genes were divided into groups based on total expression breadth and average Fop was calculated for each class. Standard errors of the means were plotted using vertical lines.
