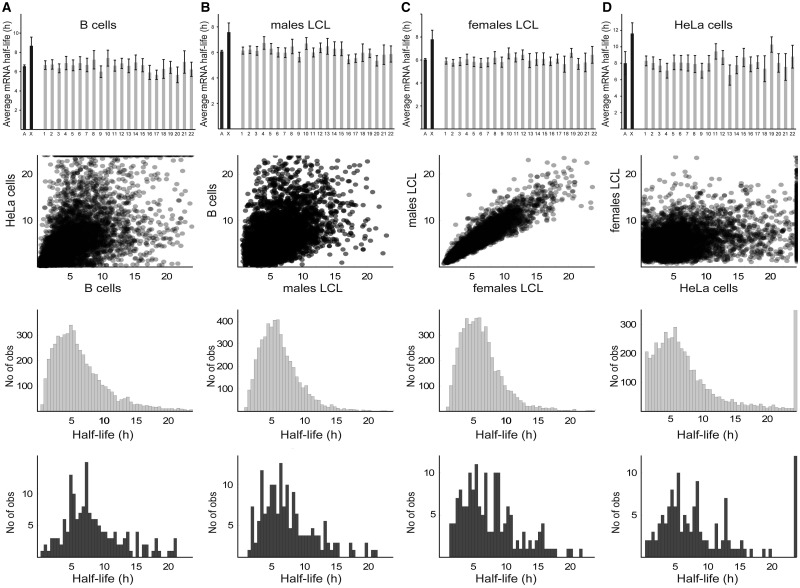
Fig. 2.—
Transcripts of X-chromosome genes have significantly longer half-lives (as measured by several methods) than autosomal transcripts in various cell types and both sexes. (row 1) Average half-life of transcripts of each chromosome. Error bars indicate 95% confidence intervals. (row 2) Correlation scatterplots of gene mRNA half-life (h). Each dot represents one gene. (row 3) Distribution of autosomal transcripts’ half-lives. (row 4) Distribution of X-chromosome transcripts’ half-lives. (A) B cells. (B) Gene-by-gene averages in four different male LCLs. (C) Gene-by-gene averages in three different female LCLs. (D) HeLa cells.

