Fig. 1.—
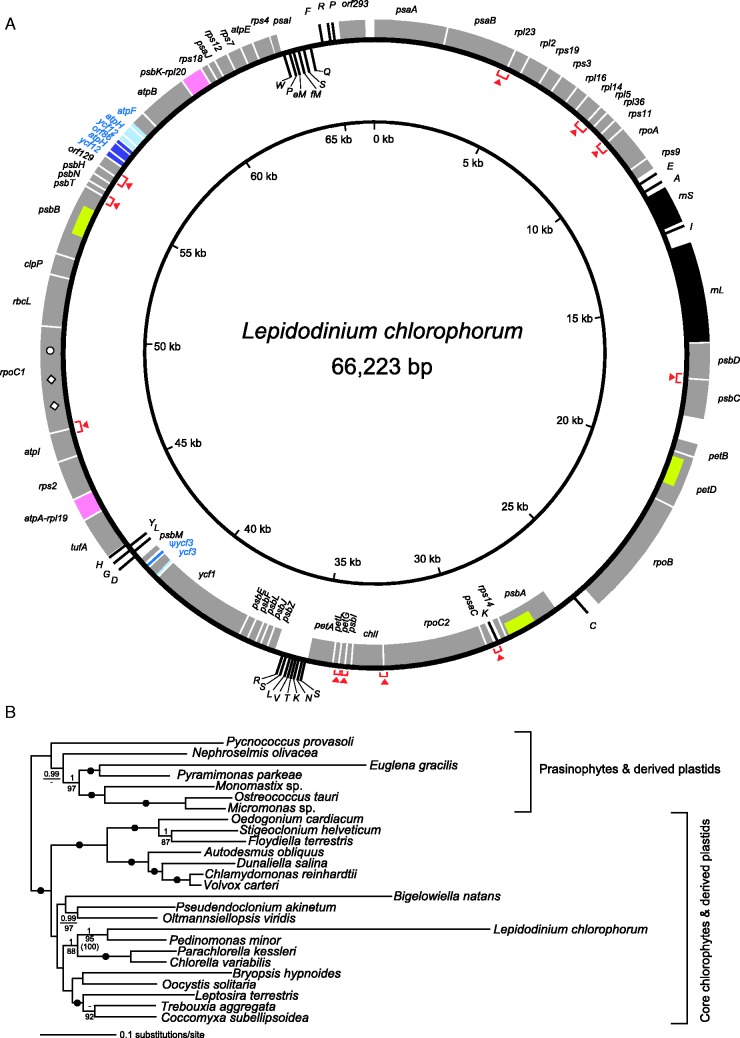
Complete plastid genome of Lepidodinium chlorophorum and ML phylogeny inferred from an alignment comprising 52 plastid proteins. (A) Physical map of the L. chlorophorum plastid genome. Protein-coding and rRNA-coding regions are shown by gray and closed boxes, respectively; tRNAs and pseudogenes are shown by lines. Tandemly duplicated regions were highlighted in light blue and dark blue. Two ORFs generated by gene fusion are colored in pink (see supplementary fig. S1, Supplementary Material online, for the details). Red arrowheads indicate physically overlapping coding regions (see supplementary fig. S2, Supplementary Material online, for the details). Group II introns are depicted as yellowish green boxes (see supplementary fig. S3, Supplementary Material online, for the details). A single UAA and two UAG codons found within the rpoC1 coding region are shown by an open circle and open diamonds, respectively (see supplementary fig. S4, Supplementary Material online, for the details). (B) Phylogenetic analysis exploring the origin of the L. chlorophorum plastid. The alignment comprises 52 plastid proteins (8,917 amino acid positions in total) sampled from 26 genomes of 23 green algae and 3 green alga-derived plastids. Phylogenetic analyses were performed by both ML and Bayesian frameworks. As both methods reconstructed very similar trees, only the ML tree is shown here. BPPs and ML bootstrap values (MLBPs) are shown above and below the corresponding nodes. MLBPs less than 80% and BPPs less than 0.95 are omitted from the figure. Dots correspond to MLBPs of 100% and BPPs of 1.00. The MLBP from the analysis excluding rapidly evolving Bigelowiella natans and Euglena gracilis is shown in parentheses.

