
Fig. 2.
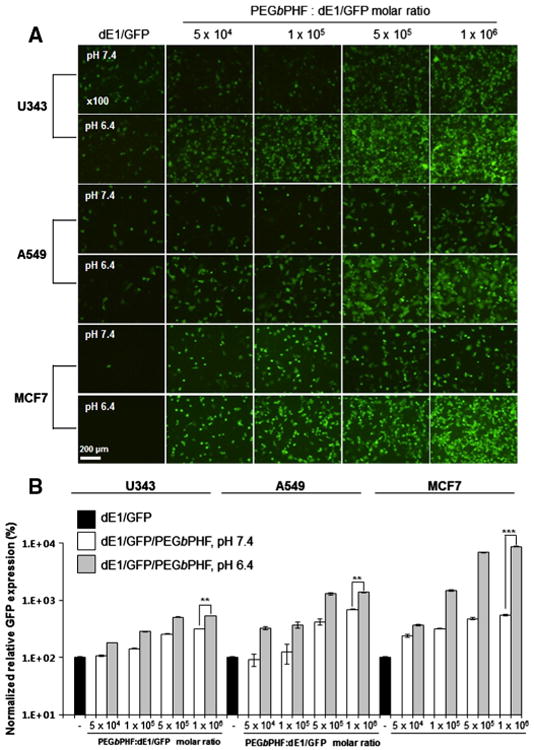
The transduction efficiency of dE1/GFP/PEGbPHF depends on the PEGbPHF/Ad molar ratio at pH 7.4 and 6.4. (A) Fluorescence images of dE1/GFP or dE1/GFP/PEGbPHF complexes. Ad particles (1 × 10¹⁰ VP) were complexed with various molar ratios of PEGbPHF (5 × 10⁴, 1 × 10⁵, 5 × 10⁵, or 1 × 10⁶). U343, A549 or MCF7 cells were transduced for 30 min with naked dE1/GFP or dE1/GFP/PEGbPHF at pH 7.4 or 6.4. At 48 h after transduction, GFP images were observed under a fluorescence microscope. Original magnification: × 100. (B) Quantitative FACS analysis of GFP expression. The normalized transduction efficiency of dE1/GFP/PEGbPHF complexes relative to dE1/GFP was expressed as the fold increase relative to naked dE1/GFP. The data are presented as the means ± SD of triplicate experiments. Symbols: **P < 0.01, ***P < 0.001 versus dE1/GFP/PEGbPHF at pH 7.4.