
Fig. 5.
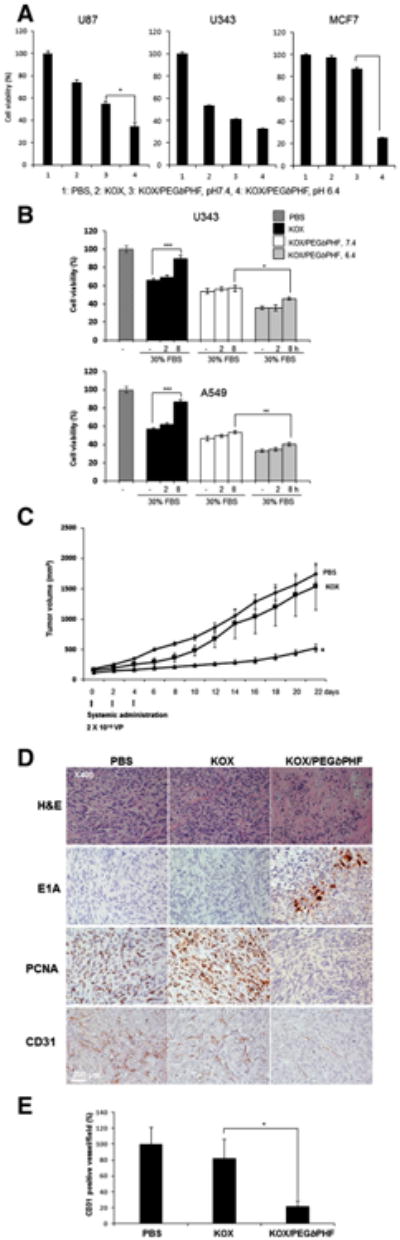
Enhanced cancer cell killing and antitumor effects of KOX/PEGbPHF. (A) U87, U343 and MCF7 cells were infected with KOX or KOX/PEGbPHF at pH 7.4 or 6.4. Cell viability was assessed by MTT assay. The PBS-treated group (control) was set at 100%. The data are presented as the means ± SD of triplicate experiments. Symbol: ***P < 0.001 versus KOX/PEGbPHF at pH7.4. (B) Cancer cell killing effect of KOX or KOX/PEGbPHF complex in the presence and absence of 30% FBS. Cell viability was assessed by an MTT assay. The PBS-treated control group was set at 100%. Data represent the means and standard deviations of triplicate experiments. ***P < 0.001 versus the absence of 30% FBS, pH 7.4. (C) Subcutaneous tumors derived from implanted U87 cells were treated with PBS, KOX (2 × 10¹⁰ VP) or KOX/PEGbPHF (2 × 10¹⁰ VP) three times every other day. Tumor volume was measured every two days following treatment. The arrows indicate the points of treatment. The results are expressed as means ± SD (n = 6 per group). Symbol: *P < 0.05 versus KOX. (D) Representative tumor tissues were stained with H&E, E1A, PCNA, or CD31 to detect necrosis, viral replication, tumor cell proliferation, and blood vessels, respectively. (E) Vessels were counted in tumor tissues for each treatment group. Six images were analyzed per group, and all data are shown as means ± SD. Symbol:*P < 0.05 versus KOX.