
Fig. 6.
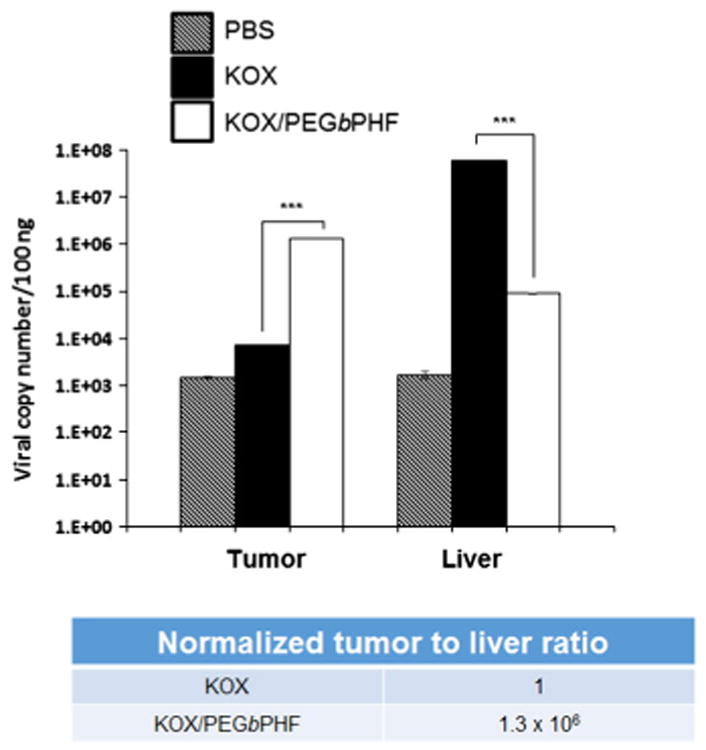
Distribution profiles of naked KOX and KOX/PEGbPHF in tumor and liver tissues. Once the U87 tumor volume reached approximately 100–150 mm3, PBS, KOX or KOX/PEGbPHF (2 × 10¹⁰ VP) was systemically injected three times every other day. Tumor and liver tissues were harvested at 24 h post-injection, and real-time quantitative PCR was performed to detect Ad genomic DNA. The data are expressed as the copy number of the Ad E1A gene. Data represent means ± SD; n = 3 for each experimental condition. Symbol: ***P < 0.001 versus KOX.